What Has Been Going on Underneath the Hood of the Portfolio?
We’ll be blunt in this first comment; it’s been a very difficult 2025 for the Aptus Compounders strategy. When running and investing in a highly concentrated stock strategy, like this one, there will be some probability for increased tracking error versus the benchmark – we understand that some tracking error is good (i.e., outperformance) and some is bad (i.e., underperformance) – the latter tends to be critiqued, while the former tends to be expected. Understanding that this is the name of the game, we’d like to use this newsletter to allow investors to see what is going through the entire team’s decision-making process during a very interesting 2025.
First, the strategy takes multiple precautions to try to minimize the overall tracking error against the S&P 500 by owning stocks that the team believes has a long runway to efficiently compound capital. But, understanding market dynamics, it’s impossible to always outperform, as one’s investing style may ebb and flow in and out of favor. Unfortunately, during 2025, the Compounders’ style of investing has been heavily out of favor. Let us explain.
Portfolio construction is very important, given the concentration in holdings – only 15 stocks are owned. The portfolio management team has a few different levers to pull to try to minimize the overall volatility of relative returns. Two of the largest contributing factors to returns that the management team considers when investing the portfolio:
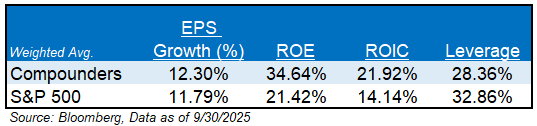
1. Investing in Lower Volatility Stocks: We tend to invest in companies that are considered “Conglomerates”. Examples within the portfolio include Microsoft Corporation (MSFT), Amazon.com Inc. (AMZN), Roper Technologies (ROP), and CHEMED Corp. (CHE). Since there isn’t a breadth of holdings, the strategy owns stocks that have multiple lines of business, which tends to help keep the overall strategy standard deviation lower than most would expect. These types of companies tend to exhibit factor tilts like higher quality. Given the diversified business models, the fundamentals tend to be very consistent over longer periods of time because not all their revenue and earnings growth drivers are in the same exact basket. Said differently, a byproduct of owning diversified businesses is that these stocks tend to exhibit lower volatility.
As shown below, the Compounders’ overall standard deviation is very close to the S&P 500’s level – a feat for only owning 15 stocks.

2. Investing in Higher-Quality Companies: The strategy tends to own stocks that we believe best exhibit higher-quality characteristics. Examples of these factors would include higher profitability, positive earnings, lower debt, sustainable growth. Empirical evidence has shown that companies that exhibit these characteristics tend to outperform, though there may be a few time intervals, like we are witnessing now, where fitful rallies occur that these factors underperform.
How Has the Compounders Style of Investing Fared in 2025?
This answer can be summed up simply: The portfolio’s style of management and factor tilts have been severely out of favor to a magnitude that is highly reminiscent of the low-quality rally of the COVID bottom. But it may be best to show this year’s performance in two different time intervals:
1. 12/31/24 – 04/08/2025: Compounders Outperformed S&P 500 by > 8%; and
2. 04/08/2025 – 09/30/2025: Compounders Underperformed the S&P 500 by > 20%.
During the first period, which witnessed a ferocious pullback, the strategy performed well. High-quality factors led during this volatile timeframe. The second period witnessed a fitful rally of low-quality stocks, of which, the strategy should be expected to underperform, but the team has been disappointed by the magnitude of underperformance.
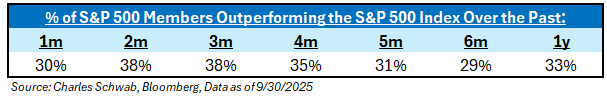
Diving deeper under the hood, dispersion has been very high – meaning that there was a lot of performance differences between stocks. Even though the market is +14.8% year-to-date, it does not mean that a rising tide has lifted all boats. It’s actually the exact opposite. There have only been a handful of stocks that have beaten the S&P 500 over recent periods:
Not only were there a handful of stocks that outperformed, but the winners were also highly concentrated in two different groupings:
1. Magnificent Seven; and
2. Low Quality and Unprofitable Stocks.
The Compounders portfolio is underweighting the Magnificent Seven and does not own stocks that the management team believes to exhibit lower quality stocks, leaving the strategy underperforming. Not only did this style of stocks outperform, but they also did so by a lot.
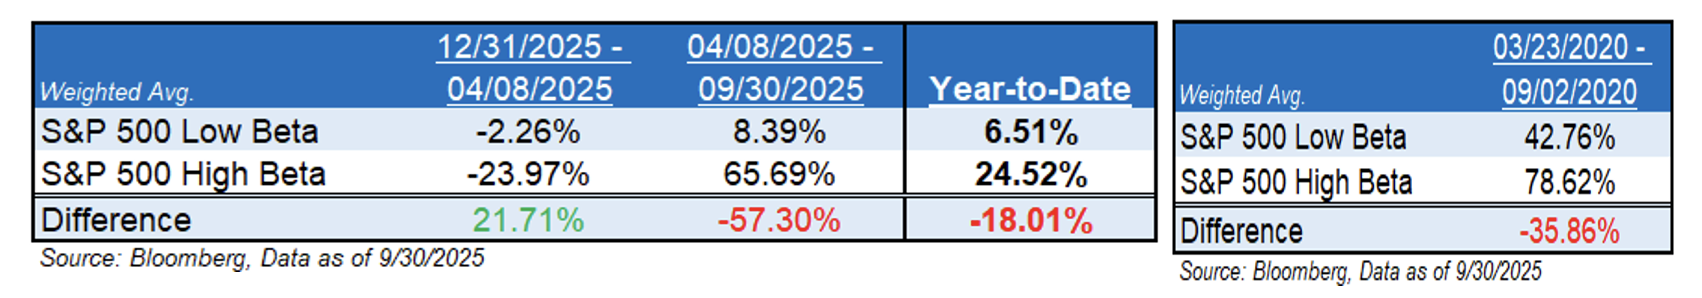
Again, the current period is very reminiscent of the rally off the COVID bottom. But surprisingly, the higher beta stocks have performed better during this time interval than the first leg of the COVID bottom rally. Hopefully, this means that this fitful rally is starting to get long in the tooth, ultimately swaying back into a market with rationality.
Since the recent market bottom in April, the Compounders have only 7 of the 15 (47%) stocks beating the S&P 500 – though this is a higher hit rate, as only ~27% of the S&P 500 members are beating the overall index. The dispersion amongst stocks and the relative performance comes from the laggards in the portfolio – six of the holdings had negative performers since the market bottom.
To say it was a difficult environment to manage through would be an understatement, but that does not mean that the team is ditching its investment style.
Moving Forward, What is the Team Doing?
This may not be a popular answer, but the team is not going to change their investment philosophy, nor chase the securities that have led the market year-to-date. The seasoned investment team has witnessed multiple fitful rallies, led by low quality stocks, and each one of these periods has ultimately been rewarded with maintaining the course. There needs to be an understanding that there will always be periods of time when the strategy performs well and when it doesn’t – one’s actions during these periods of time is when the money is made, as many investors tend to make suboptimal decisions. The team firmly believes that the best thing to do is to allow time to be our best arbitrage.
It feels like everyone out there is only searching for multi-baggers over a short-term time horizon. We are not going to say that this investment style will spontaneously combust, but there can be a lot of irrational exuberance on the retail side of the investor ledger during the current environment. Looking for short-term wins is not one of the objectives of the strategy – nor will it ever be.
Like a baseball manager, our job is to create one of the most resilient nine-man rosters out there. We’re going to own a few stocks that we believe can consistently hit home runs, some stocks that have a high percentage of getting on base, and some stocks that we keep in the batting lineup because of their defensive prowess. We’ve always said that if every single stock in the portfolio is outperforming, that we’d be disappointed because that means every single one could underperform. We want our defensive minded stocks to perform well on the downside, which occurred from 12/31/24 – 04/08/2025, but our stocks with more firepower have been on a hitting drought over the last six months during the fitful rally. We have conviction that this drought will end.
As we have always said about this concentrated stock portfolio – we remain optimistic. We once read that optimism is a way of explaining failure, not prophesying success. Said another way: saying you are optimistic does not mean you think everything will be flawless and great. It means you know there are going to be failures, problems, and setbacks, but those are what motivate people to find a new solution or remove an error – and that is what you should be optimistic about.
It’s been few and far between when this strategy has seen setbacks – but we are witnessing one right now. But we continue to remain optimistic, while being pragmatic about improving our process. We won’t always be correct on every single stock that we own in the Aptus Compounders portfolio – that’s why it’s a portfolio of stocks. But we can promise you that we will continue to learn and adjust the portfolio as we see fit because all you need to do is compound your probability of success.
Why Do We Own What We Own?
American Tower Corporation (AMT): Not only are the fundamentals strong with AMT, but we own it as we believe it is a hedge for a lower interest-rate environment and has shown historical outperformance during periods of volatility. Knowing this, we’d assume that it would underperform during a heavy, risk-on environment like we’ve witnessed in 2025.
Fundamentally, we expect a stronger 2H 25 in domestic leasing, steady international trends, and continued strong execution at CoreSite – the latter being an aspect of the business that is heavily undervalued.
We continue to like the stock for the following reasons:
1. Highly predictable revenues due to long-term escalators and master-lease agreements, coupled with high revenue-to-cashflow conversion rates.
2. 2022 and 2023 saw elevated leasing contributions from mid-band deployment initiatives by AT&T, DISH, and Verizon, offset by Sprint churn in the wake of T-Mobile’s integration of the Sprint network. We expect a pick-up in activity in 2025 as carriers spend to expand the reach and capacity of their 5G (and, to some extent, fixed wireless) networks.
3. Minimal balance sheet risks with a steady path toward de-levering toward the 3–5x range following the integration of recent acquisitions, with room to complement capital returns with buybacks.
4. An increasing dividend yield, following the full depreciation of older assets (e.g., acquired Alltel towers) and utilization of NOLs, could gradually broaden the company’s base of potential investors.
Amazon.com Inc. (AMZN): The stock just squeaked out a positive gain year-to-date, underperforming the majority of the Magnificent Seven. On net, investors likely wanted more granularity on framing how AWS is positioned relative to the evolving AI landscape and the scope for the mix of revenue growth and margin trajectory in the forward periods (even if not explicitly quantified due to management typically not providing segment guidance). That said, we believe it is likely that elements of capacity constraints abating (external chip supply and custom silicon efforts), scaling of both AI and non-AI workloads in forward periods & how that all translates into 2H’25 and 2026revenue growth are likely to be the biggest incremental driver of investor sentiment going forward.
Looking over a multi-year timeframe, we believe that Amazon will compound a mix of solid revenue trajectory with expanding margins supported by the growing yield/return of prior investments. We continue to see AMZN as well positioned for future outperformance as eCommerce margins continue to expand, its advertising business continues to scale and gain share, and AWS stands to benefit from the rising adoption of Gen AI workloads and from the remaining long-tailed structural growth opportunity in broad shift of enterprises towards the Cloud. Lastly, we see AMZN as a leader across most secular growth themes within our broader Internet coverage (eCommerce, digital advertising, media consumption, aggregated subscription offerings & Cloud computing).
Broadridge Financial Solutions, Inc. (BR): We believe BR represents a pair of steady hands in an uncertain market, given its consistent track record of shareholder returns, moat in its proxy business, roughly 100% FCF conversion, and emerging incremental opportunities within Wealth Management and Capital Markets.
1. BR’s ICS segment, in our opinion, benefits from significant scale and a competitive moat, while increased market participation from retail investors and increased digital communications provide growth opportunities.
2. We see BR’s GTO segment’s revenue growth being driven by sell-side financial firms of all types looking to modernize, digitize and streamline their technology platforms, especially given increased digitization and investor participation.
Finally, the combination of the two segments, along with a capital allocation policy focused on dividends and debt reduction (near term), generates a stable growth at a reasonable price (GARP) investment, in our opinion, with mid-to high-single-digit organic revenue growth, annual margin expansion, and high-single- to low-double-digit adjusted EPS growth.
CHEMED Corp. (CHE): Saying that the Health Care space has been a very difficult place to invest in would be an understatement. Even the bellwethers of United Healthcare (UNH) and Elevance Health (ELV) couldn’t dodge the carnage.
Like AMT, CHE is in the portfolio to provide exposure to smaller capitalization stocks and protect capital during periods of volatility. Of which, small caps have underperformed Large Caps, and there has been a heavy risk-on rally since the April 8th lows – an environment unfavorable for CHE. But, from the start of the year until April 8th, CHE outperformed the S&P 500 by 23.1%, returning 8% – acting how we would like it to.
Heading into the year, we could see some investor skepticism for CHE, as Wall Street expectations did not reflect growth and margin deceleration in 2026, resulting from Medicare cap mitigation. Since then, the stock pulled back, alongside overall expectations. We believe that the stock’s valuation has adjusted enough to reflect next year’s headwinds, & recently released Medicare rates for FY ‘26 came out better-than-expected, which likely brings earnings to the higher end of expectations. Management is repurchasing shares (expect most of $480M buyback authorization to be used in 2H 25), which should help inflect the stock NT.
Being cognizant of performance, we acknowledge that investors would want to see ’26 guidance and some level of performance to show that cap issues and Roto headwinds are indeed manageable before valuing the stock at its historical trading range.
We continued to believe that CHE is the best way to play the current Health Care sector, given its capital allocation policies and diversified revenue streams.
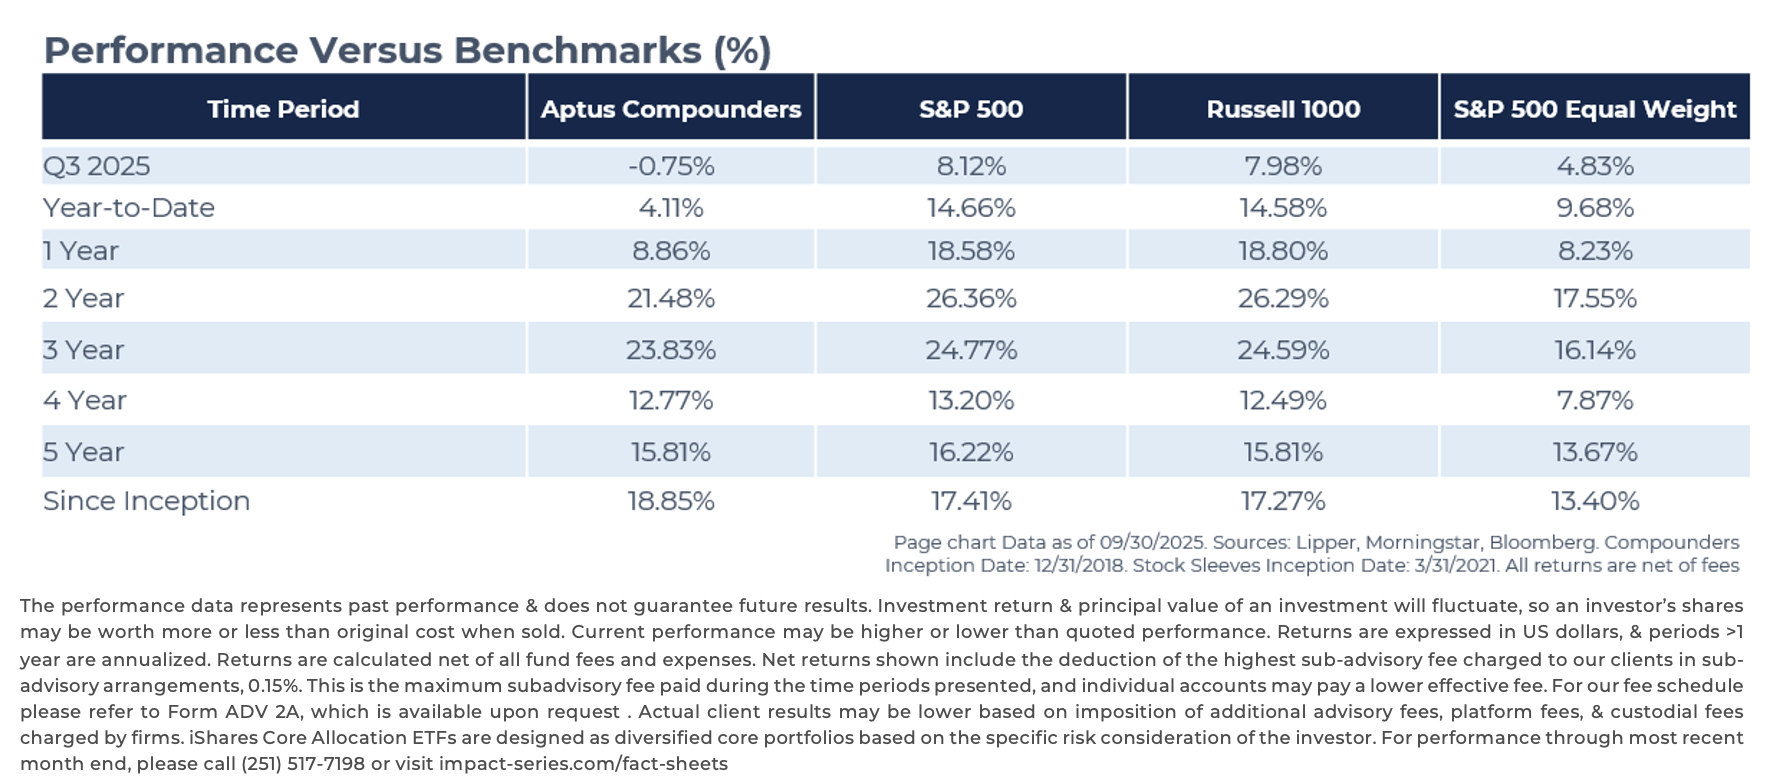
Copart, Inc. (CPRT): Copart may be the stock that we have received the most questions regarding – we understand, given the relative underperformance year-to-date. We’ve owned the stock since the inception of the strategy in late 2018, and it has added value relative to the benchmark. In fact, it has doubled the S&P 500 performance since we purchased the name. It’s key to understanding that not all stocks go up all the time. Some stocks slowly drift higher, while others go up, take a break, and then continue their upward trajectory – something we call the “stair-step method”. This is normal and we believe that CPRT tends to fall into the latter.
Copart operates the largest global marketplace for salvage vehicles, with expanding businesses in non-insurance and construction equipment markets. We like the consistent “Rule of 40” metrics (revenue growth plus EBITDA margin), which should support a premium multiple. But for now, investors are focused on slower growth and share dynamics, which suggests the stock could churn a bit until growth accelerates or buyback activity resumes.
Diamondback Energy Company (FANG): Diamondback is an inflation hedge in the portfolio and also should perform well in risk-on rallies. Unfortunately, it’s done better on the former than the latter this year, but that is due to exogenous forces in the Energy space. Ultimately, oil pricing and supply dynamics have hurt all Energy companies in 2025, even with FANG, being the highest quality operator in our opinion, not being spared from the carnage.
Nonetheless, we believe FANG remains among the most resilient E&Ps that is underpinned by leading edge operational, capital, and production performance in the Permian. Leading edge drill and frac days provide room to further improve, which can further reduce the current peer leading break-even point. We also think near-term potential asset sales could significantly enhance FANG’s balance sheet and support increased stock buyback optionality.
Management remains cautious on the oil macro but acknowledged that some of the risks seen earlier this year have dissipated. Accordingly, FANG is progressing with its “yellow light” indicator, a step-down from the prior “red”, and will have a 250+ well DUC backlog by YE2,5, providing the ability to grow if a “green” light occurs. Oil production levels (pre-STR) likely remain in the low 490’s Mb/d, up from the prior 485-490 Mb/d “red light” target.
The 2025 outlook gets stronger, but we still see some opportunities for it to improve. 2025 guidance was bolstered with $100million less capital (to $3.4-3.6 billion), while production stepped up 2-3%to 900 Mboe/d (489 Mb/d). Drilling performance remains an operational strength with the best wells achieving spud-to-TD’s at under five days. This along with fewer well TILs to reach production targets, enables FANG to maintain a healthy DUC backlog that allows flexibility to build back toward a 500+ Mb/d (pre-STR) oil productive capacity when commodity prices rebound. Natural gas and NGL production improved, given better capture and yields, which makes the overall oil cuts lower but not a concern, as oil productivity remains strong.
In the Compounders portfolio, we want to own the best, and FANG is the best in Energy – in our opinion.
JPMorgan Chase & Company: This may surprise a lot of investors, but JPM is the best performing stock in the portfolio – even besting NVDA. Don’t worry, this surprises us too, but we’ll take it as the stock benefited from a better operating environment.
The main takeaways from the stock are simple: Customer sentiment is strong as the fog of uncertainty lifts. The upcoming quarterly market revenues are expected to be up at a high-teens percentage rate YoY, which is better than most analysts had modeled previously. Additionally, Q3 2025 IB revenues should be up low double-digits YoY (slightly better than expected, as well) – and the tone from management has continued to sound optimistic moving forward. Taken together, some upward pressure on EPS estimates has helped the stock’s performance and a constructive update at recent conferences that served as a good reminder of JPM’s excellent momentum and scale, in our view
Microsoft Corporation (MSFT): Microsoft has continued to execute on its strategy, but shares have taken a breather lately as questions around the evolving relationship with OpenAI, durability of Azure growth, and health of its Productivity apps, given Agentic computing have weighed on shares. But we have full conviction in a path to shedding those weights and witnessing a broadening set of tangible growth drivers.
We like the setup for the stock going forward. With Azure growth accelerating and CAPEX being driven by their revenue backlog, the stock is set up extremely well. Most of software is slowing, and no other company can deliver Microsoft’s combination of strong double-digit revenue growth and GAAP margins in the mid-40%. With the downside risk protection of Microsoft and the EPS/FCF growth this is a stock that every investor should have significantly in their portfolio. With the strength of the results, we believe the stock can continue to yield a higher valuation.
ServiceNow, Inc. (NOW): Our thesis attempts to balance our positive long-term view on the business with the acknowledgement that near-term valuation is challenging. We see the relative valuation multiple holding as growth durability and incremental margin improvement from monetizing and deploying AI, and total company growth in the 20% range should power the stock to outperform if this holds true. For longer-term investors, we believe that you can overlay ServiceNow vs. other iconic software businesses (MSFT, CRM, ADBE, etc.) at this stage in time ($10B + revenue), and following a similar path should result in relative outperformance in future years.
We believe ServiceNow has a substantial GenAI monetization opportunity, from the low hundreds of millions to multi-billions. We see ServiceNow’s advantages to drive GenAI/Pro Plus adoption lying in being the incumbent with a critical foothold in daily operations, being able to invest heavily in innovation with its balance sheet/cash flow/R&D team (and building on existing capabilities).
Overall, we believe that ServiceNow is the bellwether in the space and is a long-term cornerstone position in a growth strategy.
NVIDIA Corporation (NVDA): There’s not much to say about NVDA – except for, keep on, keepin’ on.
Overall, the recent quarterly results were good, though with the guide perhaps just a hair light of the latest expectations, and while bears might point to computing revenues falling sequentially in the quarter and an “only” inline(ish) datacenter guide, this was really just around continued messy China dynamics, which we don’t see an end in sight. But we believe guidance was still very respectable even as it continues to leave China as upside rather than count on it and appears to indicate a sharp acceleration in the Blackwell ramp into next quarter, suggesting core fundamentals remain robust. And the general outlook and environment overall still seem encouraging, with compute requirements moving ever upward, and Jensen suggesting potential for trillions of dollars of AI infrastructure spending by the end of the decade.
Progressive Corporation (PGR): Simply said, the stock has taken a breather – and that’s OK. A lot of the pessimistic sentiment is due to expected slowing growth.
We don’t know when the stock will be done underperforming. But we do know that it is trading at a relative to S&P 500 P/E multiple lower than at any time since March 24, 2000 (the peak day of the dot-com bubble). If you want a potential catalyst, I think we get one at year-end when the annual variable dividend is announced. Many Wall Street expectations are ~ $10/share, which would equate to a healthy dividend (plus $0.40 of regular dividends) representing a 4.3% yield at the current share price. At the end of the day, we believe that a $10 number is not very complicated to achieve: a) margins, but particularly underwriting margins (essentially best-ever); b) growth (at the highest third of the historical range); and c) capital utilization/leverage (modestly below historical averages). At $10/share, it equates to just above a 50% payout ratio (as compared with an 18-year average of 46%, which includes the two non-dividend-paying years 2008 and 2022).
Going toe-to-toe against the loudest bearish sentiment – autonomous vehicles and the PGR narrative. Why we don’t believe it:
-
- Frequency and severity trends don’t seem to corroborate the sell thesis. Related technologies are bringing frequency down modestly, but severity is up materially, more than offsetting the benefit. Meanwhile, frequency of high severity accidents (fatalities, total wrecks, unreported incidents/high deductibles, etc.) is flat to up.
- The personal auto industry doesn’t underwrite liability profitably and might benefit from shifting liability to commercial carriers. The managed care and warranty insurance markets make lots of money without the liability burden.
- The personal auto market (66% of market share among the top 5, 200 companies with less than 100bps of market share) is in a massive consolidation phase (that Progressive is winning). AI should accelerate it. There are a lot more earnings to come before 2060.
All-in-all, we continue to love Progressive, albeit Flo.
Quanta Services, Inc. (PWR): Broadly based, after decades of flat demand growth, the increasing need for electricity to run data centers has boosted profitability for utilities and power companies, transforming a sector previously known thought of as reliable and slow-moving. We don’t see this narrative slowing down.
We see the company’s ability to translate best-in-class execution (this is our belief) into a structurally larger TAM, ultimately reducing cyclicity and providing downside risk. We see Quanta uniquely positioned to capture solution-based data center partnerships, incremental renewable tailwinds, long-cycle 765kV transmission projects, and large-diameter pipeline recovery, supporting a high-teens EPS CAGR into the next decade. With shares having pulled back from summer highs, we believe the market is underestimating both consistency and torque, creating an attractive entry point at current levels. With this, we can see earnings per share growth, continuing to compound at an 18% rate in the near future.
We understand that the stock is trading at a premium, but the consistency, lower risk of Quanta’s biz model, and accelerating prospects all make this a compelling stock to own, even after the recent rally. We don’t think that investors should sit on the sidelines after recent performance, as the strong management team continues to raise guidance further into next year. Amidst concerns of excessive hype, this company has found a way to consistently hit targets, find innovative angles, and is the most successful at consistently executing M&A in their peer space.
Roper Technologies (ROP): Roper is a prime example of how difficult the software industry has been in the market this year. It feels like the market is long semiconductors and subsidizing the long by shorting software – basically, no software company has been spared.
Recently, the company had a modest Q2 2025 operating beat and announced an attractive $800M high-teens percentage growth software acquisition. Roper raised the low-end of 2025 guidance by $0.10, even while absorbing $0.05 deal dilution. It is growthier deals like Subsplash that are incrementally boosting Roper’s software organic revenue growth from a legacy +MSD% toward a zippier mid-8% target.
Management also noted there is +10% of margin opportunity at this new faith-based vertical. The biggest overhang on shares, in our view, is the ongoing risk-on investor sentiment that is resulting in a buyer’s strike in high-quality compounders like ROP.
In our view, Roper is still indisputably one of the highest-quality names within the multi-industry sector. It leads the pack in EBIT margin and free cash flow conversion thanks to its portfolio of low capital-intensity and profitable SaaS and network-based businesses. Roper has also generated among the highest organic and total revenue CAGRs in the sector, showing that it has multiple legs for operating momentum besides M&A.
Longer term, Roper’s M&A firepower should be fueled by its sector-best FCF generation and investment-grade leverage. We note that this is a competitive advantage in a rising rate environment, as private equity firms will have a harder time levering up to acquire companies; therefore, Roper has greater flexibility in acquisition price. Management has previously characterized its sweet spot for deal sizes at +$400 million in valuation, with some opportunities in the pipeline that are +$1.5billion. Finally, the company estimates that it has historically only allocated 10% of its M&A capital on bolt-ons, with the remaining majority being used for platform acquisitions. We believe Roper will maintain this same mix for its future deal flow as well.
Visa, Inc. (V): Some could say that Visa is the hyperscaler for the payments industry. We are increasingly convinced that Visa (OP) can maintain its double-digit growth algorithm despite a headline US card volume growth of 6-7% driven by growth internationally (including share gains from domestic schemes), structurally high growth in cross-border and transactions, sustained and growing contribution from VAS, and optionality from new flows. Separately, we are increasingly confident that Visa’s moat will remain intact (and perhaps solidify) with the changing nature of commerce and perceived rivals (FinTechs, Crypto) are partners for growth.
Walmart Inc. (WMT): While Q2 2025 earnings were not the cleanest, with an unexpected ~$450M headwind from higher self-insured general liability claims, the quarter still illustrated that the core fundamentals of the WMT bull case are intact and accelerating. Comparable sales came in above expectations (positive transactions), and the quarter also showed continued strength across the high-margin growth vectors, including advertising up ~46% YoY, ~15% membership growth, and ~25% global eCommerce growth (profitability improving again). Tariffs remain an overhang for retail broadly, but we view Walmart’s scale, agility, and pricing strategy as key differentiators. Sales were consistent across the quarters, with improving general merchandise trends and a solid back-to-school selling season. Each of these aspects continues to give us confidence in Walmart’s value proposition and opportunity for growth as we move through 2H ‘25 and into the upcoming holiday selling season.
Longer-term, WMT’s transformation into a people-led, tech-powered, omni-channel retailer is driving above trend top-line growth, improved profitability (business mix), faster asset turns (supported by heavy tech/automation investments), and higher ROIC. Importantly, WMT’s fastest growing revenue streams generate the highest incremental margins, which in turn fuel reinvestment back into the business. This virtuous cycle places WMT in an enviable position to play offense while simultaneously improving margins/ROIC.
Disclosures
Past performance is not indicative of future results. This material is not financial advice or an offer to sell any product. The information contained herein should not be considered a recommendation to purchase or sell any particular security. Forward looking statements cannot be guaranteed.
This commentary offers generalized research, not personalized investment advice. It is for informational purposes only and does not constitute a complete description of our investment services or performance. Nothing in this commentary should be interpreted to state or imply that past results are an indication of future investment returns. All investments involve risk and unless otherwise stated, are not guaranteed. Be sure to consult with an investment & tax professional before implementing any investment strategy. Investing involves risk. Principal loss is possible.
The content and/or when a page is marked “Advisor Use Only” or “For Institutional Use”, the content is only intended for financial advisors, consultants, or existing and prospective institutional investors of Aptus. These materials have not been written or approved for a retail audience or use in mind and should not be distributed to retail investors. Any distribution to retail investors by a registered investment adviser may violate the new Marketing Rule under the Investment Advisers Act. If you choose to utilize or cite material, we recommend the citation be presented in context, with similar footnotes in the material and appropriate sourcing to Aptus and/or any other author or source references. This is notwithstanding any considerations or customizations with regards to your operations, based on your own compliance process, and compliance review with the marketing rule effective November 4, 2022.
Advisory services are offered through Aptus Capital Advisors, LLC, a Registered Investment Adviser registered with the Securities and Exchange Commission. Registration does not imply a certain level or skill or training. More information about the advisor, its investment strategies and objectives, is included in the firm’s Form ADV Part 2, which can be obtained, at no charge, by calling (251) 517-7198. Aptus Capital Advisors, LLC is headquartered in Fairhope, Alabama. ACA-2509-26.