Our asset allocation structure is designed to do better in the tails; both the right (good) and left (bad) tails. Simply own more stocks, less bonds, while keeping risk in check, and let the structure work for you; that’s our North Star.
Right Tail Driven by Allocation Effects: A larger allocation to stocks helps capture more upside when markets are friendly
Left Tail Driven by Manager Selection: Ownership of hedges creates separation when markets aren’t as friendly.
With all portfolios up double digits for 2025, it is hard to complain about performance; however, we would have liked our portfolios to have performed even better given the right tail market environment since the lows in April. Going into the April drawdown, our tilts within equities were beneficial as hedges and quality buffered the impact of the equity pullback; however, since the lows, those same tilts have dampened some of the asset allocation benefits.
Simply put, our overallocation to quality/average stock and underweight to ex-US has kept our structure from “firing on all cylinders”. While our big motto stayed true—digestible results even when we’re wrong—we are constantly grading ourselves and pragmatically looking for areas of improvement.
We’ve always said that an investor should make a trade for three different reasons:
(1) To better the structure
(2) To make a decision based on a fundamental perspective
(3) To time the market
We will never solely make a trade based on timing the market, but we will consider timing when we make a fundamental-based trade. When trading to better the structure of the allocation, we care less about timing because, over longer periods of time, making sure that we are adhering to a structure should be the best long-term contributor to achieving higher CAGRs (“compounded average growth rate”). This is one of those trades.
The Theme of This Rebalance
Within this rebalance, we are reducing our exposure to the equal weight S&P 500 in favor of “own more beta”. Equal weight exposure was used to balance out our equity exposure, given its broader exposure to smaller large cap and mid-cap stocks. In theory, this was a good idea given the lower valuation threshold of these companies versus the Magnificent Seven (“Mag 7”).
In practice, many of these companies don’t illustrate the operating leverage that we have come to love and adore, which is exhibited in the top stocks.

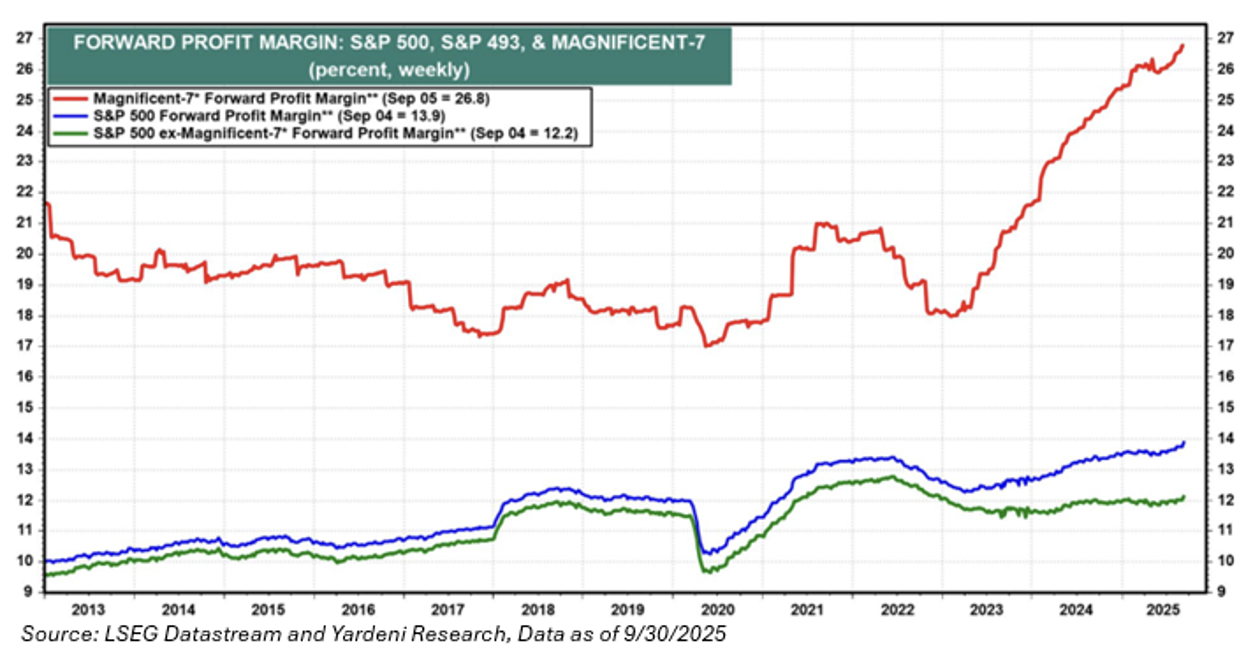
Additionally, the S&P 493 has been in a perpetual state of “upcoming” future positive earnings revisions that haven’t panned out. While longer-term performance of the equal-weight S&P 500 has been strong, sometimes you need to listen to what markets are telling you. Simply put, when 40 cents of every $1 invested in the market goes to the top 20 holdings by market cap, overweighting the other 480 stocks is like spitting into a strong wind.
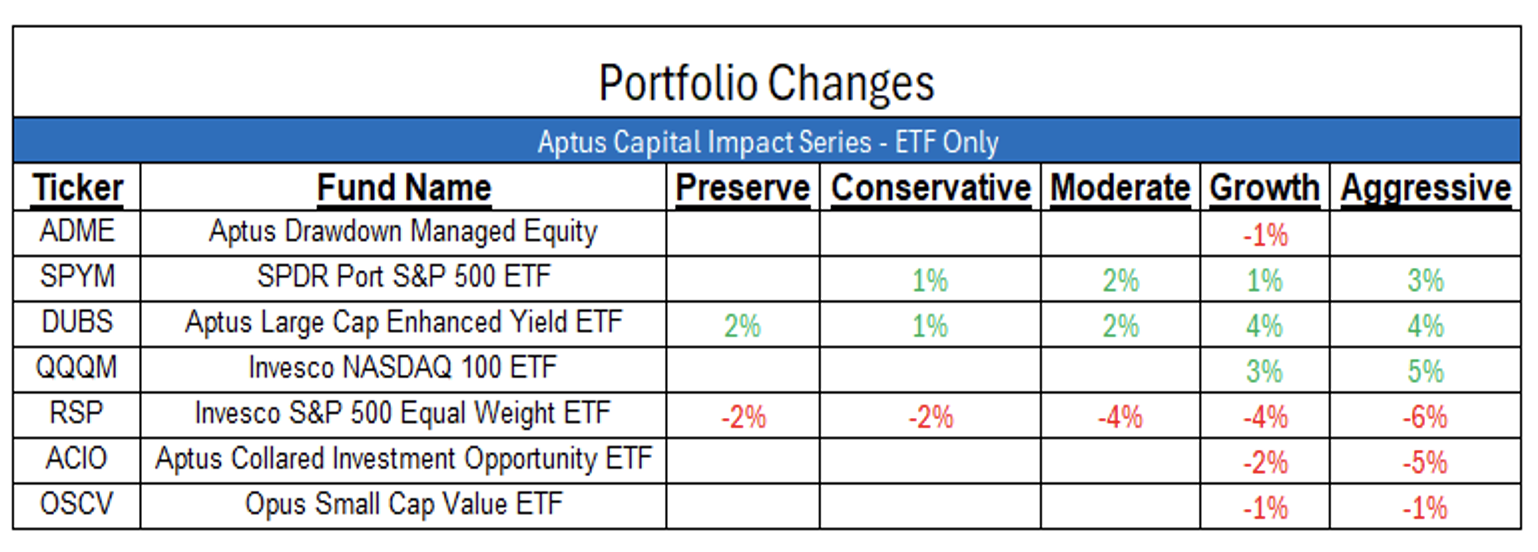
The Trades
We have strong conviction in the trades below, as we think they improve the structure of our allocation.
Opus Small Cap Value ETF (“OSCV”) Commentary
Trades: Slightly Trimming in Growth and Agg. Growth.
Rationale: Our overweight to quality small cap stocks will continue to be a key tenet of our portfolios relative to benchmarks. OSCV brings a quality, US-focused characteristic to our portfolios, which we believe will improve long-term compounded returns while adding diversification benefits. Owning companies that benefit from reshoring and capex spend on powering up America should continue to filter through to many of the names we own.
Additionally, as the consumer is supported by tax cuts from the OBBB as well as stimulus measures via direct checks and lower interest rates, we expect holdings to benefit. Buying companies with strong growth at favorable valuations and decent yields gives our portfolio additional growth drivers.
 Data as of 09.30.2026
Low-quality has dominated markets in the past year, especially since the market’s recent bottom in April. This is a period of time where we would not expect the strategy to perform well compared to the benchmark. While these fitful rallies do happen, we believe that the team’s legacy has been to maintain a quality rigor regardless of current investment trends and environments that do not align with their style of management.
Ultimately, we believe that OSCV is a better diversifier to a portfolio than the equal-weight S&P 500, hence why we are keeping most of the position. It’s been rare for this strategy to see this type of setback. The PM’s remain optimistic while being pragmatic about improving their process.
OSCV won’t always be correct on every single stock, nor will it outperform across every market environment; that’s why it owns a portfolio of stocks. But we can promise you that we will continue to learn and adjust the portfolio over time because all you need to do is compound your probability of success.
For more details, please click here.
Equal Weight S&P 500 (RSP)
Trades: Reduce across the board.
Rationale: We are reducing our equal-weight exposure for three reasons: (1) Fundamentals, (2) Diversification benefits, and (3) To simply own more market beta.
1. Fundamental
Quarter after quarter, it feels like the earnings growth rate of the S&P 500’s average stock continues to get pushed out in time for aligning with the growth rate from the market-cap-weighted S&P 500. Given the lack of operating leverage within these names, there’s a possibility that the area has been re-rated lower.
2. Diversification Benefits
We’ve continued to see that the overall portfolio allocation gets more diversification benefits from owning a sliver of U.S. Small Caps than from the average stock. Thinking about the investment “Tic-Tac-Toe Board”, the S&P 500 is basically a Large Growth allocation, which would signify a top-right location, while Small Caps, specifically value tilted, would be in the bottom-left. Conceptually, this may be a better way to diversify our beta overweight than owning the S&P 500 average stock.
3. To Own More Beta
We’ve always said that you’ll rarely get fired for owning the S&P 500. In fact, our hedged equity exposures protect against weakness in the S&P 500, allowing us to own more risk assets, more comfortably.
S&P 500 Beta Exposure – (1) SPDR Portfolio S&P 500 ETF (SPYM), Aptus LC Enhanced Yield ETF (DUBS), Invesco NASDAQ 100 ETF (QQQM)
Trades: Additional exposure is being added across the board, coming primarily from the S&P 500 Equal-Weight Proceeds.
Rationale: The core belief of our allocations is to simply own as much beta as possible, without injecting more risk. We’ve recognized in this recent right tail market that some of our tilts to the average stock and quality have detracted from just letting our stocks act like stocks. With that, we’ve reduced our weighting in specific tilts and have conceded to owning as much beta as possible, while keeping risk in check.
Aptus Collared Investment Opportunity (ACIO)
Trades: Reduce hedged exposure in Growth and Aggressive models.
Rationale: Reflecting the trade above around our core belief of owning beta, we also recognized that our hedged exposure may have been higher than needed in the more risk-on models. We believe active hedging is a powerful tool to help create capital to deploy as hedges generate value in drawdowns. This creates a positive asymmetry that can benefit all models, from preserve to aggressive. But we also recognize that the hedged exposure should vary across the risk spectrum, namely, reducing that exposure as you get more aggressive and investors are more comfortable riding out volatility.
By reducing the exposure in the growth and aggressive models, we look to add more firepower in the portfolios while still owning enough hedged exposure to protect if we do see a pullback in the S&P 500.
International Exposure
Trades: None, but remain underweight relative to the benchmarks.
While the weaker US Dollar has benefited ex-US stocks tremendously in 2025, that tailwind is likely exhausted unless substantial economic reforms occur. Red tape, high taxes, less-incentivized labor, and less overall growth have weighed and will likely continue to weigh on businesses outside the U.S. While implementing a step up in defense budgets sounds stimulative on paper, it has shown to have a limited impact on widespread GDP growth.
To sum this up, in our opinion, the best companies in the world are in America. On top of that, the bulk of all private and venture money flows to America. We believe global investors will be unwilling to abandon the U.S. market given its size, liquidity, and access to growth-oriented companies. Additionally, we continue to believe the current U.S. administration will stimulate growth in 2026 (and beyond). We’re doubtful in the policy framework of “if you can’t innovate, regulate” (credit Brad).
We maintain our slight underweight to ex-US in our allocations compared to benchmarks.
In summary, our opinion is that the asset allocation structure within an investment portfolio is the most critical factor influencing long-term performance and consistency of returns. The objective for investors should be to maximize Compound Annual Growth Rate (CAGR) in line with their individual risk tolerance. Over longer periods of time, greater than 90% of a portfolio’s return variability can be attributed to its asset allocation structure rather than individual security selection or market timing. Given its importance, we evaluate our asset allocation construction critically, constantly grading ourselves on upside/ downside (or drawdown-adjusted) capture metrics relative to our benchmarks.
We believe this rebalance has the potential to improve the asset allocation structure of portfolios, which could lead to better upside participation with the level of risk control needed per client.
Disclosures
Past performance is not indicative of future results. This material is not financial advice or an offer to sell any product. The information contained herein should not be considered a recommendation to purchase or sell any particular security. Forward looking statements cannot be guaranteed.
This commentary offers generalized research, not personalized investment advice. It is for informational purposes only and does not constitute a complete description of our investment services or performance. Nothing in this commentary should be interpreted to state or imply that past results are an indication of future investment returns. All investments involve risk and unless otherwise stated, are not guaranteed. Be sure to consult with an investment & tax professional before implementing any investment strategy. Investing involves risk. Principal loss is possible.
The content and/or when a page is marked “Advisor Use Only” or “For Institutional Use”, the content is only intended for financial advisors, consultants, or existing and prospective institutional investors of Aptus. These materials have not been written or approved for a retail audience or use in mind and should not be distributed to retail investors. Any distribution to retail investors by a registered investment adviser may violate the new Marketing Rule under the Investment Advisers Act. If you choose to utilize or cite material, we recommend the citation be presented in context, with similar footnotes in the material and appropriate sourcing to Aptus and/or any other author or source references. This is notwithstanding any considerations or customizations with regards to your operations, based on your own compliance process, and compliance review with the marketing rule effective November 4, 2022.
Advisory services are offered through Aptus Capital Advisors, LLC, a Registered Investment Adviser registered with the Securities and Exchange Commission. Registration does not imply a certain level or skill or training. More information about the advisor, its investment strategies and objectives, is included in the firm’s Form ADV Part 2, which can be obtained, at no charge, by calling (251) 517-7198. Aptus Capital Advisors, LLC is headquartered in Fairhope, Alabama. ACA-2601-36.
