FEBRUARY RECAP
- The Coronavirus continued to dominate the headlines in February, as it sent the market into a frenzy, dropping 12.44% in six trading days marking the first market correction since December 2018.
- Much of the market’s fear is derived from two reasons: that the US might impose shutdowns, like those implemented by China, affecting domestic demand. Secondly, the fear that the virus will cause a material global economic slowdown.
- Fears of the Coronavirus drove investors to safety. The 10- and 30-year treasuries are both at their lowest yields EVER and the 3mo/10yr yield curve is inverted again. The market is pricing in further Fed rate cuts following the impacts of the virus.
- From a credit perspective, we started to see pressure on spreads the last week of the month. Eight months of gains from taking on additional credit risk were wiped away. It will be harder to assess the impact on high yield credits until we get a material understanding of the virus impact on the global economy (obviously these companies are the least positioned to weather a global supply chain glut).
REMAIN CALM – WE WERE READY
We’ve been a broken record in saying that we find credit unattractive and risk elevated. Our repetitive portfolio repositioning has been one of lowered exposure to bonds and higher exposure to risk-managed stocks. We’ve also been a broken record on the value of our hedges, which are designed to go up in price when stocks go down. A couple of reminders from October and February.
2019 created an illusion that the stock market delivers return free of risk. The last week of February reminded us otherwise.
Thankfully, our risk-management is allowing us to methodically take advantage of cheaper prices while providing protection. These are crucial concepts we need to cover to calm any nerves.
DRAWDOWN PATROL
The form of risk that worries us most is peak to trough moves in a portfolio, i.e. drawdown. Forget other measures of risk…$1mil turning into $800k is a 20% drawdown risk, and it’s this risk that can bring emotional actions detrimental to overall outcomes.
As a firm, this is our identity; building strategies and portfolios that can rise when markets rise and stand strong when the rug is pulled. When drawdown goes from being something that could happen to something that is happening, we want our investors to avoid emotionally-driven decisions. This is accomplished by managing drawdown.
THE ROOF WAS FIXED WHEN THE SUN WAS SHINING
You fix the roof when the sun is out, not in the middle of the storm. Hopefully this silly analogy helps drive home our point.
Our ability to defend against drawdown risk stems from our background in derivatives. Yes, that’s a fancy finance word, but here’s all you need to remember: Derivatives were created to reduce uncertainty. When we interact with derivatives under the hood of your portfolios, that’s what we are doing – seeking to define uncertainty. As Peter Bernstein puts it, “the product in derivative transactions is uncertainty itself.”
And uncertainty has a price.
When markets are rising, 401k balances are increasing, and the sun is shining…the price of uncertainty stays low. We cannot stress enough, transacting in this uncertainty demands most of our time and attention, and it’s constantly occurring on your behalf. We want to buy cheaply priced uncertainty when we can because…
When unknowns occur, such as the Coronavirus, the cost of uncertainty goes through the roof. Those that own protection against rising uncertainty benefit. Those that don’t, are at the mercy of the markets.
The benefits of this are mathematical, but more importantly, behavioral.
OUR PORTFOLIOS
While the rest of the markets are entering full blown panic mode, we are not. We can methodically look for opportunities thanks to volatility.
The price of uncertainty has been reset higher, much higher. The high-level benefits we felt during this market turbulence are twofold:
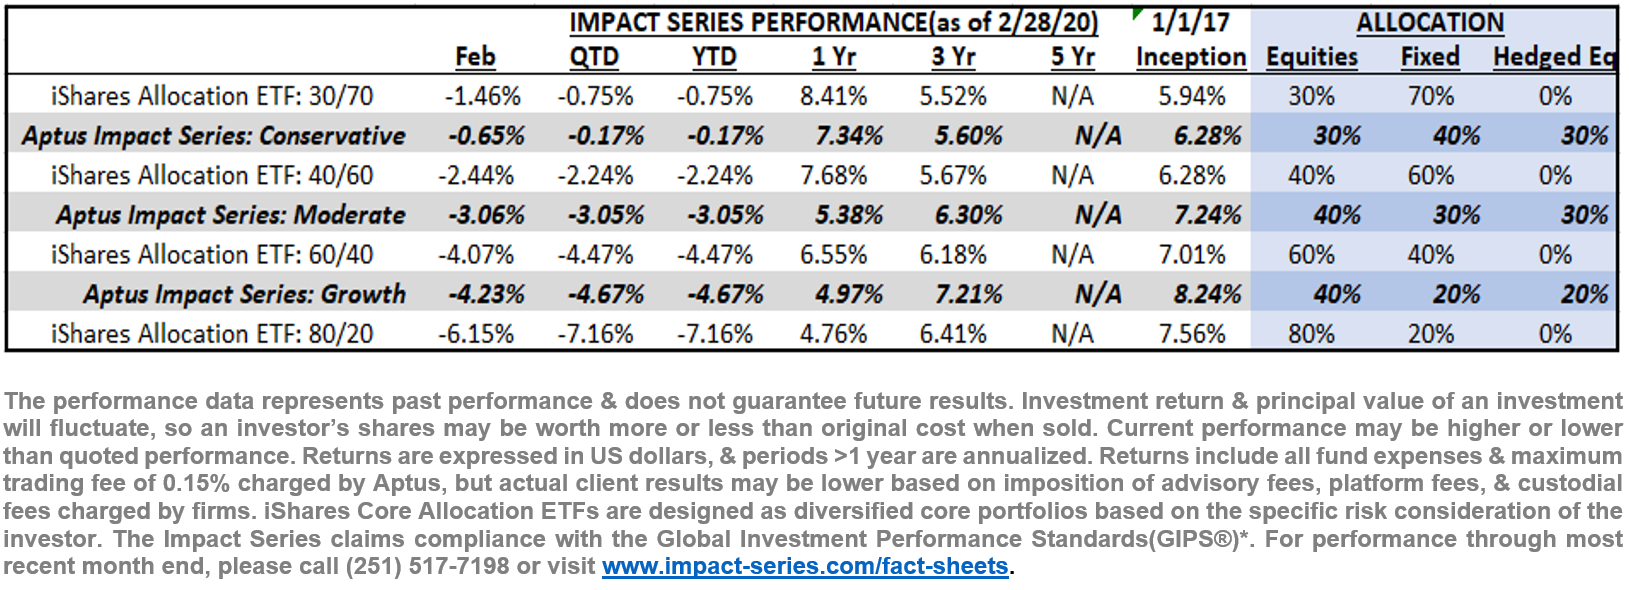
- Protection against drawdown. From Feb 19-28, the S&P 500 fell over 12% while our composites felt no more than ¼ (Conservative) to ½ (Growth) of that. The values of our funds’ hedges and exposure to long volatility has increased, which in turn offsets a portion of the drop in stock prices (remember that chart we shared last month!). Please reach out for portfolio specifics, we’d love to discuss!
- Buying at Lower Prices. By owning uncertainty as it’s getting reset higher, we can now sell something that has become expensive and put those proceeds to good use. If you remember last month’s update with the green and yellow dots, you want capital to redeploy when we are closer to the green dots than the yellow. At the fund level, we’ve been able to roll our protection to redeploy into more hedges as well as cheapened stocks! More shares, more dividends, more exposure to stocks if markets rebound, more protection in place if they don’t, and most importantly, more peace of mind knowing our actions can be devoid of panic no matter what March holds for us.
APTUS STRATEGIES
The strategies we create internally are the drivers behind our ability to inject the risk management discussed above. We harp on a sum of the parts focus, as that matters most, but the protection built into our funds allowed us to act calmly amidst the panic. It was those strategies that directly benefited the sum of the parts.
While each strategy we run served its individual purpose, we must single out our Defined Risk Strategy once again. It has altered the makeup of our portfolios on both the upside & downside. It’s been able to provide yield, return, low correlation, and protection – a compelling combination.
Look at these numbers on the Defined Risk Strategy vs. the SPY (SPDR S&P 500 ETF Trust) and the AGG (iShares Core U.S. Aggregate Bond ETF) they speak for themselves:
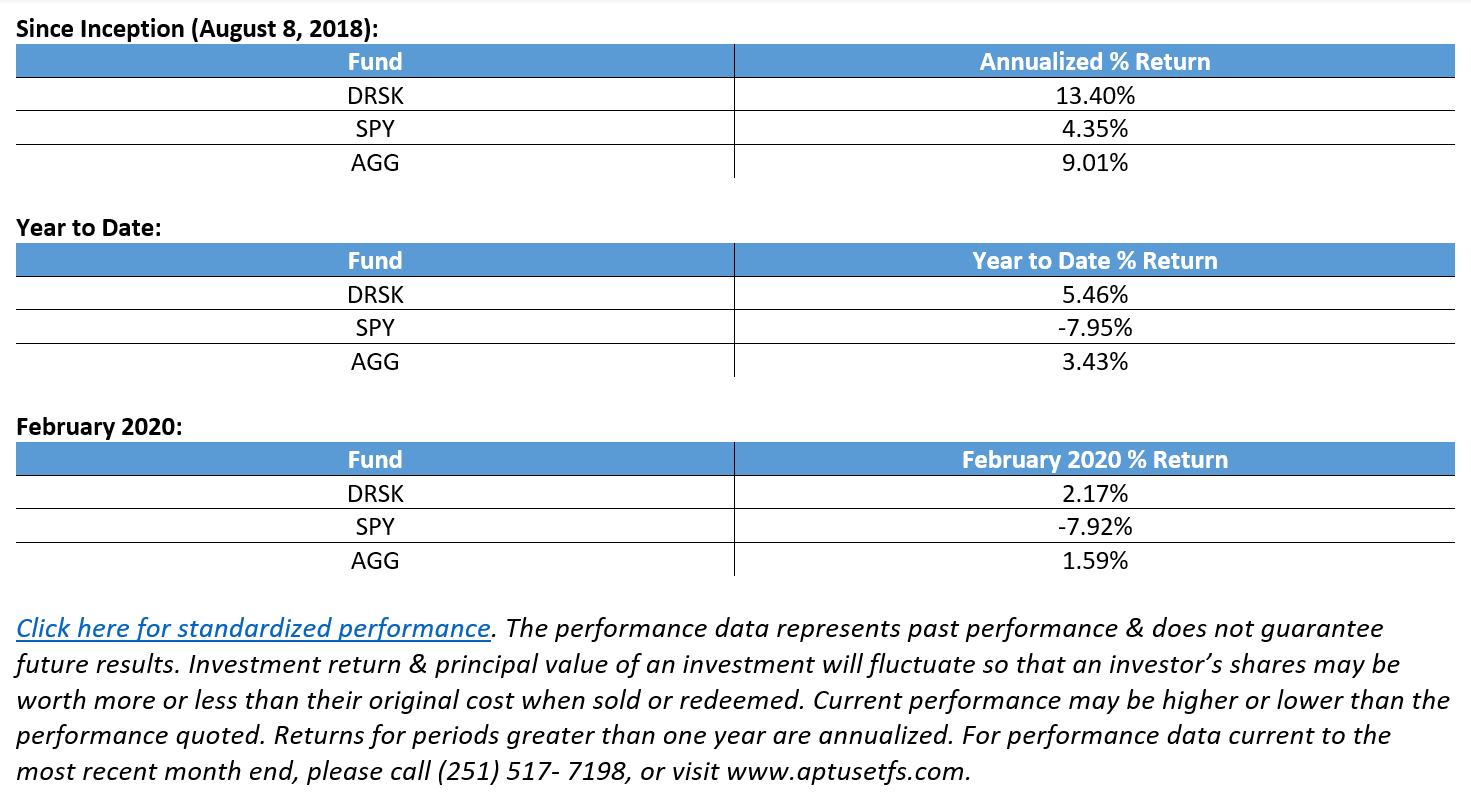
Click here for standardized performance. The performance data represents past performance & does not guarantee future results. Investment return & principal value of an investment will fluctuate so that an investor’s shares may be worth more or less than their original cost when sold or redeemed. Current performance may be higher or lower than the performance quoted. Returns for periods greater than one year are annualized. For performance data current to the most recent month end, please call (251) 517- 7198, or visit www.aptusetfs.com.
CLOSING
We have no idea what the impact of Coronavirus will end up being and we won’t act like we do. We do know, the uncertainty of the impact is high, and markets are telling us that. What we hope you take away from this update.
If Aptus is involved with managing your portfolio, more volatility should not concern you. 2019 gave investors nothing but sunshine and our models participated. Let it rain.
If you’d like a walk-through on anything mentioned here, please reach out directly. We enjoy the discussion!
Fact sheets are still being updated but wanted to be sure you had ammo in hand. As always, let us know if you’d like any help customizing this for your own use with clients. We’ve been working on a “Content Hub” that will give approved users access to all needed research, look for an invite this week. For now, performance across composites and benchmarks here:
Thank you,
The Aptus Team
251.517.7198
The Impact Series is a model portfolio solution developed by Aptus Capital Advisors, LLC. Aptus Capital Advisors, LLC is a Registered Investment Advisor (RIA) registered with the Securities and Exchange Commission and is headquartered in Fairhope, Alabama. Registration does not imply a certain level of skill or training. For more information about our firm, or to receive a copy of our disclosure Form ADV and Privacy Policy call (251) 517-7198 or contact us. Information presented on this site is for educational purposes only and does not intend to make an offer or solicitation for the sale or purchase of any securities or to advise on the use or suitability of The Impact Series, or any of the underlying securities in isolation. Information specific to the underlying securities making up the portfolios can be found in the Funds’ prospectuses. Please carefully read the prospectus before making an investment decision.
This commentary offers generalized research, not personalized investment advice. It is for informational purposes only and does not constitute a complete description of our investment services or performance. Nothing in this commentary should be interpreted to state or imply that past results are an indication of future investment returns. All investments involve risk and unless otherwise stated, are not guaranteed. Be sure to consult with an investment & tax professional before implementing any investment strategy.
Portfolio holdings information as of February 28, 2020. There is no assurance that the specific securities listed will remain in the Portfolio. Asset allocation and portfolio holdings may differ from the model among accounts in the composite. Aptus employs a diversification strategy using a combination of tactical and strategic, active and index-based Exchange Traded Funds to represent specific asset classes. These representations should not be considered a recommendation to buy or sell an ETF. As with all investments, ETFs have risks. For more information or a prospectus, please contact your Investment Advisor.
The Impact Series Benchmarks are the iShares Core Allocation ETFs. iShares Core Asset Allocation ETFs are designed as diversified core portfolios based on the specific risk consideration of the investor. Each iShares Core Allocation Fund offers exposure to US stock, international stock, and bond at fixed weights and holds an underlying portfolio of iShares Core Funds. Investors choose the portfolio that aligns with their specific risk consideration. iShares Core Allocation ETFs offer investments to meet a Conservative (iShares Core Conservative Allocation ETF), Moderate (iShares Core Moderate Allocation ETF), Growth (iShares Core Growth Allocation ETF), and Aggressive (iShares Core Aggressive Allocation ETF). Source: Blackrock. The volatility (standard deviation) of the Impact Series may be greater than that of the benchmark.
*The Impact Series claims compliance with the Global Investment Performance Standards (GIPS®) and has prepared and presented this report in compliance with the GIPS standards. The Impact Series has been independently verified for the periods January 1, 2017 through December 31, 2017. The verification report is available upon request by calling (251) 517-7198. Verification assesses whether (1) the firm has complied with all the composite construction requirements of the GIPS standards on a firm-wide basis and (2) the firm’s policies and procedures are designed to calculate and present performance in compliance with the GIPS standards.
SPY (SPDR S&P 500 ETF Trust) is an exchange-traded fund incorporated in the USA. The ETF tracks the S&P 500 Index. The Trust consists of a portfolio representing all 500 stocks in the S&P 500 Index. AGG (iShares Core US Aggregate Bond Fund) seeks to track the investment results of the Bloomberg Barclays U.S. Aggregate Bond Index. The index measures the performance of the total U.S. investment-grade bond market. The fund generally invests at least 90% of its net assets in component securities of its underlying index and in investments that have economic characteristics that are substantially identical to the economic characteristics of the component securities of its underlying index. The volatility (standard deviation) of the Defined Risk Strategy may be greater than that of the indexes. It is not possible to invest in the indexes.
Please carefully consider the fund’s objectives, risks, charges, and expenses before investing. The statutory or summary prospectus contains this and other important information about the investment company. For more information, or a copy of the full or summary prospectus, visit www.aptusetfs.com, or call (251) 517-7198. Read carefully before investing.
Investing involves risk. Principal loss is possible. Investing in ETFs is subject to additional risks that do not apply to conventional mutual funds, including the risks that the market price of the shares may trade at a discount to its net asset value (NAV), an active secondary market may not develop or be maintained, or trading may be halted by the exchange in which they trade, which may impact a fund’s ability to sell its shares. Shares of any ETF are bought and sold at Market Price (not NAV) and are not individually redeemed from the fund. Brokerage commissions will reduce returns. Market returns are based on the midpoint of the bid/ask spread at 4:00pm Eastern Time (when NAV is normally determined for most ETFs), and do not represent the returns you would receive if you traded shares at other times. Diversification is not a guarantee of performance and may not protect against loss of investment principal. ACA-20-47.
Aptus Capital Advisors, LLC serves as the investment advisor to the Aptus Funds. Aptus Capital Advisors, LLC is a Registered Investment Advisor (RIA) registered with the Securities and Exchange Commission and is headquartered in Fairhope, Alabama. The Funds are distributed by Quasar Distributors LLC , which is not affiliated with Aptus Capital Advisors, LLC. The information provided is not intended for trading purposes, and should not be considered investment advice.