
“O Muse!,
Sing in me, and through me, tell the story,
Of that skilled investor, in all ways of contending,
An asset allocation, searching for alpha years on end…”
-Invocation of Muse
An Invocation of Muse serves as a prologue of events to come, famously used by Homer when writing his two major epic poems, the Iliad, and the Odyssey. Now, in modern times, used by the Coen Brothers in their satirical comedy, O Brother Where Art Thou?.
The movie, at its core, is a work of comparative mythology, blended with the American South. The protagonist, Ulysses Everett McGill, leader of, The Soggy Bottom Boys, led two fellow jailbirds across Mississippi in pursuit of a treasure, all while evading the evil Sheriff Cooley, who was hot on their trail. Investors themselves are on their own archetypal journey as they try to navigate the market, seeking the treasure of risk parity, in a world of rising inflation expectations and slightly positive real yields, coupled with a monetary policy change that has no comparative period. These factors are the source of why fixed incomes inability to provide safety this year to an overall asset allocation; the market’s evil Sheriff.
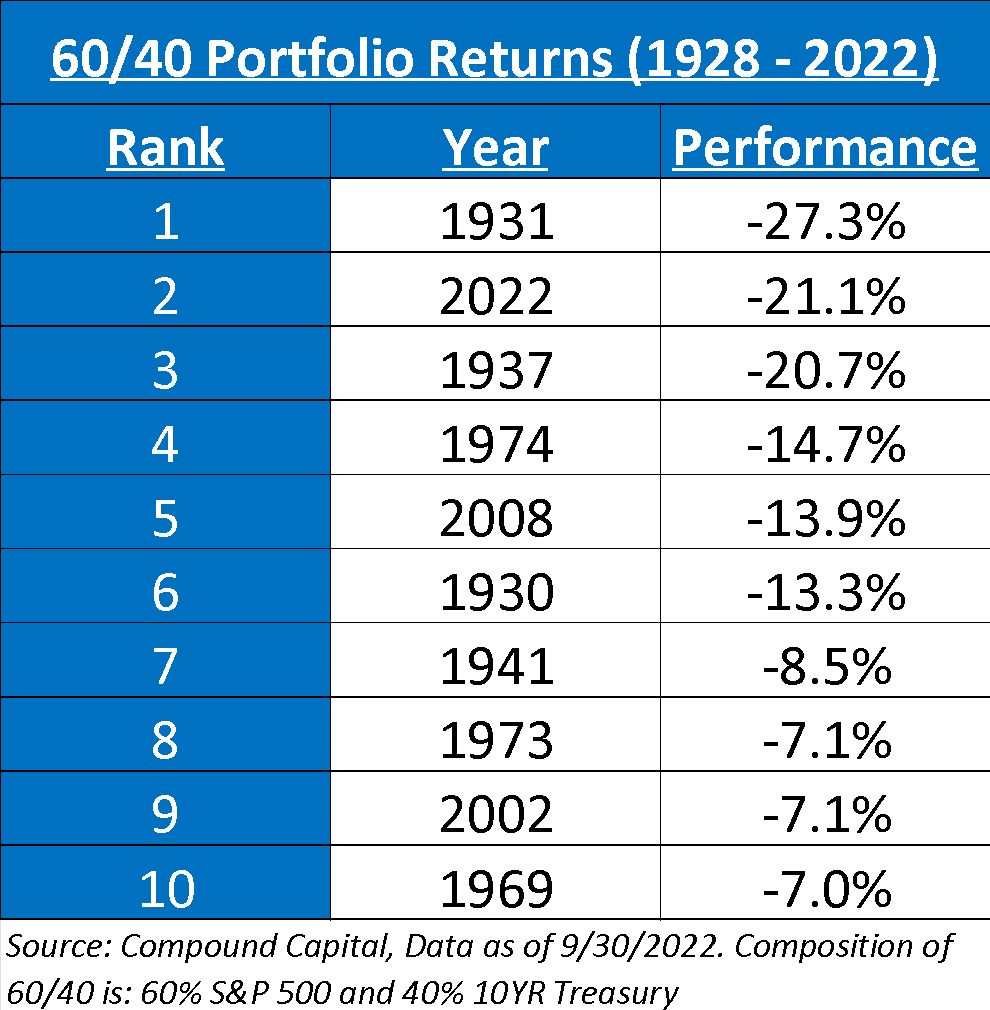
An adventure it has been for investors, as the 60/40 portfolio is on pace for its second worst year ever in the modern era, putting investors, specifically those with a more risk averse profile, in a tight spot. This year has already been 50% worse than the drawdown witnessed during the financial crisis and rivals a period from the Great Depression. The most amazing superlative in our opinion is that there has never been a period that has seen three quarters in a row of negative performance for both stocks and bonds.
The high velocity spike in interest rates this year has been the reason for both equity and bond performance. Higher rates have hurt longer duration fixed income investments, as reinvestment risk is introduced, and for equities, higher rates mean a higher discount rate, hurting valuations. In our opinion, rates have been driving the market’s performance all year, and that will likely not change in the interim.
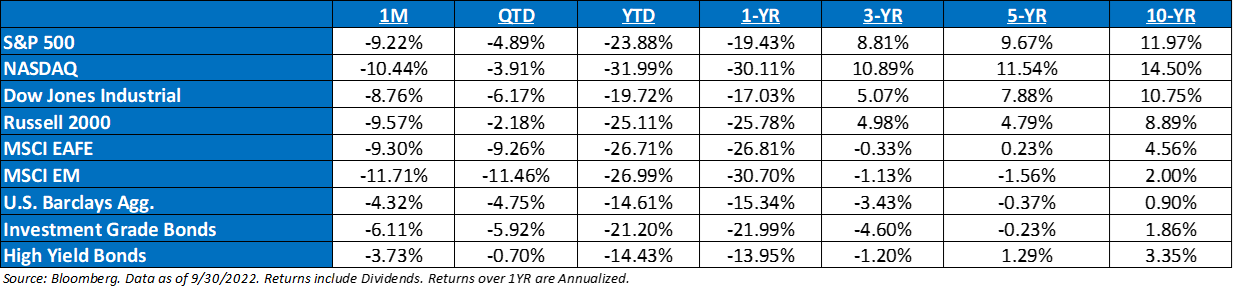
Given the aforementioned factors, there has been virtually nowhere to hide in this market.
Do Not Seek the Treasure
Just like the singing women (sirens) in O Brother Where Art Thou lured the jailbirds away from their treasure quest, we see the same temptation to be led off course in the market. The market’s sirens – the Fed, inflation, and earnings reductions – are leading investors off their quest for financial independence.
Siren 1: The Fed
Fed Chairman Jerome Powell, the leader with the capacity for abstract thought, and the rest of his “brain trust”, have continued to be behind the ball all year, as their bet that inflation would be “transitory” did not transpire. This has allowed investors to take their future estimates about as seriously as George “Baby Face” Nelson’s bank robbery hostages took him. If you go back to March of ‘21, when money growth was over 30%, the Fed was forecasting 2% inflation with no need for them to raise the Fed Funds Rate until ‘23, and real GDP in ’22 was estimated to be 3.4%. Fast forward to today, and the reality is that real GDP will likely be flat or slightly negative this year, coupled with PCE inflation over 6% and core PCE at 4.6%. Meanwhile, money supply growth is essentially zero.
Ultimately, avoiding a stop-and-go monetary policy remains the key moving forward, a lesson learned the hard way back in the 1980s. The great hope is that there’s an ability to destroy job openings before destroying actual jobs. The Fed has removed any remaining doubt about its commitment to getting inflation under control and has sparked volatility not only in the equity markets that is likely to persist, but also the bond market.

While we agree that there is growing evidence of weakness in the domestic economy, it does not yet appear to be enough to force a material shift in the Fed’s intended pathway, nor do we believe that central bank decisions overseas will undermine the Fed’s focus on reinstating price stability. While the Fed does not appear poised for a more dovish stance just yet, market participants have continued to try to tempt the Fed into pivoting sooner.
Siren 2: Inflation
It’s no secret that consumers have been feeling the ramifications of the “R-U-N-N-O-F-T” inflation. After August’s inflation report, the Fed shifted into fifth gear on restrictive policy. While headline inflation did fall -0.2% year-over-year during the report, continuing its descent from 9.1%, the core reading increased to 6.3% year-over-year. Of specific note, there has been resiliency in the stickier aspects of the readings. These stickier aspects, like rents, medical care services ,and labor, increased 7.7% on an annualized basis in August. This increase was substantially higher than July’s reading of 5.4%, leaving many people wondering if inflation will linger much longer than anticipated.
This has led to more harsh commentary from the Fed regarding their battle toward taming inflation. When speaking about getting inflation back under control and closer to their 2% target, Chairman Powell noted that “there isn’t a painless way of doing this.” That quote tells us that restoring price stability will likely require maintaining a restrictive policy for quite some time. Furthermore, the impact of rate hikes to alleviate sticky-price inflation will require some patience and do little to remedy supply side issues. The demand for flexible-priced items (such as used cars) has begun to cool, and borrowing costs for other interest rate sensitive components of the economy (such as housing), have become materially more expensive. The Fed is attempting to knock down all the market dominoes: slow down economic activity which should slow hiring which should slow wage growth which should ultimately slow inflation.
Siren 3: Earnings Revisions
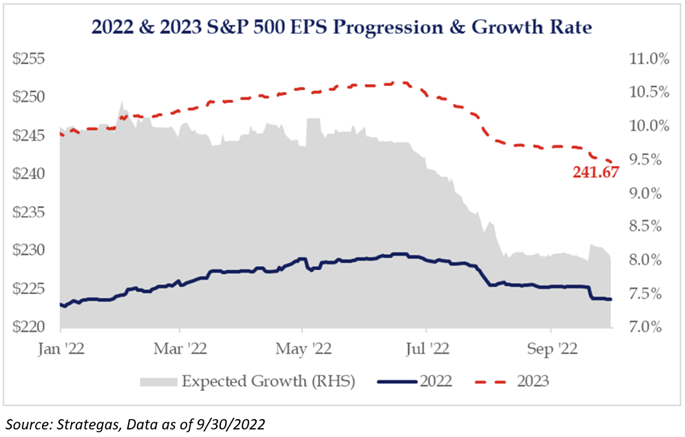
Fed policy and inflation have been under the market’s microscope for most of the year, but a new siren has entered the realm. We believe that earnings will likely play an increasingly larger role from a directional standpoint given the debate about the extent to which consensus estimates still need to come down to reflect a softening macro backdrop and inflation/margin pressures. We remain skeptical of current 2023 earnings projections, and believe they are likely too high. On average, earnings tend to fall between 15% – 20% during a “mild” recession, yet estimates are only 7% off their recent highs.
As of quarter-end, the S&P 500 P/E valuation may only be ~2x turns higher than its historical average. Yet, we believe that this may be a mirage, given the fact that we have only seen the “P” decrease, not the “E”. Broadly speaking, we don’t believe that P/Es are worth worrying about too much right now because the game over the next 18 months or so is about trying to determine how much the “E” needs to come down across indices and individual companies. We will be focusing on earnings revisions, which we believe could be a market driver moving forward.
Is You or Is You Not Looking Through the Windshield?
Consistent with the frenetic pace of modern life, investors have been conditioned to think in “V-shaped” terms, which tend to happen more easily when money is free. Moving forward, it is going to be difficult for investors to have the patience to allow economic developments play out over time – who can blame investors? Just look at two recent instant gratification memories that are etched into our brains:
- The Cause: The Fed was tightening in 2018, which led to a brutal sell off into Christmas
The Effect: Two weeks later, the Fed pumped the breaks.
- The Cause: The COVID-induced lockdown, which led to 20M job losses.
The Effect: Unlimited QE
Given the level of inflation and the Fed’s “brain trust” persistent nature of only focusing on one aspect of their dual mandate, suggests that the market will be in a period of the restrictive policy for longer than expected, potentially inhibiting a new market regime.
Since the creation of the Federal Funds Rate in 1971, every single technical bear market has been met with some form of policy easing, except for this year. Yet, in this case, the Fed has increased the fed funds rate with three consecutive 75bp hikes and a potential fourth in November. We know and understand that the nomenclature, “this time is different”, tends to be a death wish in the investment world, but given the amount of tightening by both rate hikes and balance sheet reduction, this increase may create a new return environment moving forward. We maintain a fair degree of suspicion of any market rally of the quarter-end lows until inflation expectations become anchored
As the market continues to evolve, investors need to evolve with it.
Will the Market Ever Be a Suitor?
Being an investor in this market has left many people feeling like they’ve been hit by a train. But, as Penny, Ulysses’ wife, says: lots of respectable people have been hit by trains.
However, we believe that one can protect themselves from injury in the future. I once read that most of the time markets behave quite normally and accounts for about 85% of the time. During these periods, investing tends to be “easier”. These periods will have little significance. It’s the other 15% of the time that matters – these periods could be in either direction – elation or terror. How one handles these times of euphoria and panic are most relevant to portfolios. It’s no secret that we are probably in one of those 15% periods. As investors, our behavior right now is the most important thing to focus on, because staying invested tends to be one of the most beneficial (in)actions one can do.
It has been a very difficult market this year, but we believe that a great reset has begun. Equity valuations have come down and repaired income and for the first time since before the Financial Crisis, have some type of respectable yield. While understanding that the market may be in a differentiated risk and return environment, given this potential reset, we believe that there will be light at the end of the tunnel. In our opinion, the U.S. will find it’s treasure and will ultimately have jobs, have prospects, and once again, the U.S. will be bona-fide.
Disclosures
Aptus Capital Advisors, LLC is a Registered Investment Advisor (RIA) registered with the Securities and Exchange Commission and is headquartered in Fairhope, Alabama. Registration does not imply a certain level of skill or training. For more information about our firm, or to receive a copy of our disclosure Form ADV and Privacy Policy call (251) 517-7198 or contact us here. Information presented on this site is for educational purposes only and does not intend to make an offer or solicitation for the sale or purchase of any securities.
This commentary offers generalized research, not personalized investment advice. It is for informational purposes only and does not constitute a complete description of our investment services or performance. Nothing in this commentary should be interpreted to state or imply that past results are an indication of future investment returns. All investments involve risk and unless otherwise stated, are not guaranteed. Be sure to consult with an investment & tax professional before implementing any investment strategy.
Past performance is not indicative of future results. This material is not financial advice or an offer to sell any product. The information contained herein should not be considered a recommendation to purchase or sell any particular security. Forward looking statements cannot be guaranteed.
The S&P 500® is widely regarded as the best single gauge of large-cap U.S. equities. There is over USD 11.2 trillion indexed or benchmarked to the index, with indexed assets comprising approximately USD 4.6 trillion of this total. The index includes 500 leading companies and covers approximately 80% of available market capitalization.
The Nasdaq Composite Index measures all Nasdaq domestic and international based common type stocks listed on The Nasdaq Stock Market. To be eligible for inclusion in the Index, the security’s U.S. listing must be exclusively on The Nasdaq Stock Market (unless the security was dually listed on another U.S. market prior to January 1, 2004 and has continuously maintained such listing). The security types eligible for the Index include common stocks, ordinary shares, ADRs, shares of beneficial interest or limited partnership interests and tracking stocks. Security types not included in the Index are closed-end funds, convertible debentures, exchange traded funds, preferred stocks, rights, warrants, units and other derivative securities.
The Dow Jones Industrial Average® (The Dow®), is a price-weighted measure of 30 U.S. blue-chip companies. The index covers all industries except transportation and utilities.
The Russell 2000® Index measures the performance of the small-cap segment of the US equity universe. The Russell 2000® Index is a subset of the Russell 3000® Index representing approximately 10% of the total market capitalization of that index. It includes approximately 2,000 of the smallest securities based on a combination of their market cap and current index membership. The Russell 2000® is constructed to provide a comprehensive and unbiased small-cap barometer and is completely reconstituted annually to ensure larger stocks do not distort the performance and characteristics of the true small-cap opportunity set.
The MSCI EAFE Index is an equity index which captures large and mid-cap representation across 21 Developed Markets countries*around the world, excluding the US and Canada. With 902 constituents, the index covers approximately 85% of the free float-adjusted market capitalization in each country.
The MSCI Emerging Markets Index captures large and mid-cap representation across 26 Emerging Markets (EM) countries*. With 1,387 constituents, the index covers approximately 85% of the free float-adjusted market capitalization in each country.
Investment-grade Bond (or High-grade Bond) are believed to have a lower risk of default and receive higher ratings by the credit rating agencies. These bonds tend to be issued at lower yields than less creditworthy bonds.
Non-investment-grade debt securities (high-yield/junk bonds) may be subject to greater market fluctuations, risk of default or loss of income and principal than higher-rated securities.
The 10 Year Treasury Rate is the yield received for investing in a US government issued treasury security that has a maturity of 10 year. The 10 year treasury yield is included on the longer end of the yield curve. Many analysts will use the 10 year yield as the “risk free” rate when valuing the markets or an individual security.
The Bloomberg Barclays U.S. Aggregate Bond Index is a broad-based benchmark that measures the investment grade, U.S. dollar-denominated, fixed-rate taxable bond market. This includes Treasuries, government-related and corporate securities, mortgage-backed securities, asset-backed securities and collateralized mortgage-backed securities. ACA-2210-10.