Over the next few weeks, I’m going to put out a series of analysis on 2021, hitting some of the bigger relative opportunity sets within the equity market:
Week 1: Domestic v. International
Week 2: Small v. Large
Week 3: Value v. Growth
Domestic v. International:
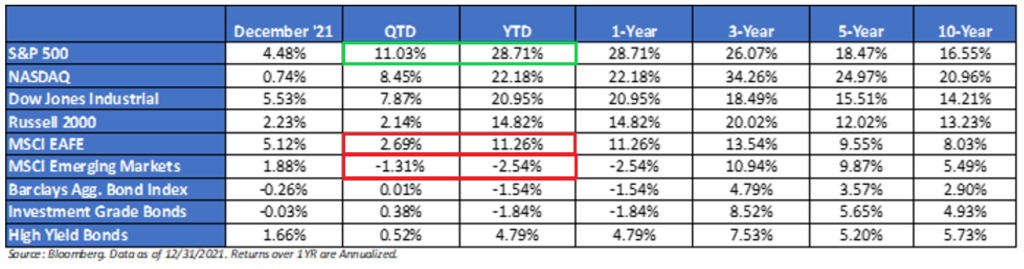
For most of the last decade, investors continue to be plagued with one of the most critical calls for an allocation – Domestic or International? Last year, the consensus amongst Wall Street was to realize U.S. profits and to re-allocate those gains into EAFE and EM – that was wrong. During the year, the S&P 500 almost returned 3x of the MSCI EAFE. If you believe that is painful, don’t even look at the relative performance between the former and Emerging Markets – over 30%! If you like putting salt in the wound, here’s another fact for you – Equities had their 21st best year ever – but even bonds outperformed EM last year – yikes.
From a longer-term perspective, the only period of prolonged underperformance of U.S. equities v. International was between 2002-2008.
Yield + Growth Framework:
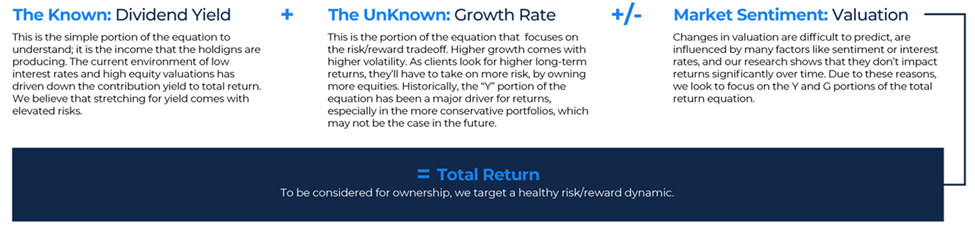
The Known: Yield
Indicated Yield:
-International EAFE: 2.63%
-International EM: 2.40%
-S&P 500: 1.35%
The Unknown: Growth
Next 12 Months Growth:
-International EAFE: +7.8%
-International EM: +7.7%
-S&P 500: +9.0%
Market Sentiment: Valuation
Currently, the S&P 500 remains one of the most expensive global markets. The perceived economic resilience of the U.S. (as well as its significant Technology exposure) are likely contributors to this phenomenon. However, should we get a weaker U.S. dollar, investors may find attractive opportunities abroad to put money to work over the coming months as the jagged global economic recovery progresses.
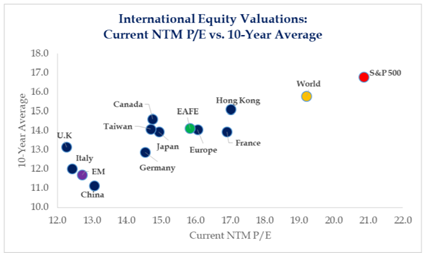
Source: Strategas, Data as of 12/22/2021
Next Twelve Months (“NTM”) Price-to-Earnings Valuations:
International EAFE: 15.01x
International EM: 11.31x
S&P 500: 21.85x
Over the last 25 years, the S&P 500 has traded on average at an 8.0% premium to international stocks. As of today, the S&P 500 trades at a 45.6% premium – substantially higher than historical measures.
Why have International Stocks Underperformed U.S. Since the GFC / Why Do U.S. Stocks Trade at Such a Premium?
- U.S. Has Higher Exposure to Growth – Given the significantly larger weight to Growth sectors, U.S. equities have consistently traded at a premium to their international counterparts. Last year’s outperformance by growth (in Large-Cap land), has taken the valuation premium to above 50%. With the Fed taper said to end in mid-March, and the dot plots signaling three hikes this year, rich valuations could pose as a headwind, especially for those stocks with weak or no earnings – growth tends to have more stocks that exhibit these characteristics.
- Higher Profitability / Faster Earnings Growth – When it comes to profits, U.S. firms are in a different league compared to their international peers. Supported by superior margins and operating conditions, in our view U.S. firms have generated significantly better profits since the GFC, this is especially true of the more dominant Growth style. In fact, U.S. profit margins have exploded, while international has stayed stagnant over the past decade. The earnings backdrop is superior for U.S. equities v. International peers, even within the Value style. As such, the superior profitability for U.S. stocks is not only driven by the Tech heavy Growth style.
- International Has More Industrial and Commodity Exposure – The International Indices have a heavier weight in manufacturing and commodity-producing markets. We believe stocks with these types of exposures tend to trade at lower multiples and have underperformed over the last decade. Not only have these areas of the market underperformed, but It’s been interesting to me that U.S. stocks have outperformed international peers, even within these more cyclical / Value areas of the market.
- Consumers Have Changed their Spending Habits from Goods to Services – Another significant headwind for international has been the rotation of consumer spending to services from goods. All of the largest weights in the MSCI ACWI ex.-U.S. index have a tight relationship with the industrial cycle, i.e., goods not services. Moving forward, the continued slowdown in the manufacturing new orders PMI and elevated input costs could further worsen the prospects for all major international equity markets moving forward.
The Age-Old Question
We think it’s no secret to the market that international equities have had more headwinds than the U.S. over the past decade (and less growth). This is reflected in the relative valuation differentials between the two style classes. Everything that we have mentioned in this blog blast is information that should be in the rearview mirror – the market knows these problems, i.e., semi-efficient. Investors need to look through the windshield – what will drive relative returns in the future?
We are not here to make bets on which asset class will outperform over the next month, year, or decade. That’s why we rely on asset allocation diversification. Proper diversification is the first layer of portfolio protection. The idea that anyone is going to consistently overweight to next year’s leading styles could be considered crazy; we see building a structure that minimizes the drag of large losers as far more realistic. More importantly, on the international side, this is why our allocation includes guard rails while investing in this space – we like the asset class from a valuation perspective, but we also want to minimize the volatility in the space – an area which tends to exhibit more volatility than domestic stocks.
At Aptus, we believe in proper diversification, owning volatility as an asset class, the importance of sequence of returns, and owning areas of the market with actual return drivers.
Disclosures:
Aptus Capital Advisors, LLC is a Registered Investment Advisor (RIA) registered with the Securities and Exchange Commission and is headquartered in Fairhope, Alabama. Registration does not imply a certain level of skill or training. For more information about our firm, or to receive a copy of our disclosure Form ADV and Privacy Policy call (251) 517-7198 or contact us here. Information presented on this site is for educational purposes only and does not intend to make an offer or solicitation for the sale or purchase of any securities.
This commentary offers generalized research, not personalized investment advice. It is for informational purposes only and does not constitute a complete description of our investment services or performance. Nothing in this commentary should be interpreted to state or imply that past results are an indication of future investment returns. All investments involve risk and unless otherwise stated, are not guaranteed. Be sure to consult with an investment & tax professional before implementing any investment strategy.
Past performance is not indicative of future results. This material is not financial advice or an offer to sell any product. The information contained herein should not be considered a recommendation to purchase or sell any particular security. Forward looking statements cannot be guaranteed.
The S&P 500® is widely regarded as the best single gauge of large-cap U.S. equities. There is over USD 11.2 trillion indexed or benchmarked to the index, with indexed assets comprising approximately USD 4.6 trillion of this total. The index includes 500 leading companies and covers approximately 80% of available market capitalization.
The Nasdaq Composite Index measures all Nasdaq domestic and international based common type stocks listed on The Nasdaq Stock Market. To be eligible for inclusion in the Index, the security’s U.S. listing must be exclusively on The Nasdaq Stock Market (unless the security was dually listed on another U.S. market prior to January 1, 2004 and has continuously maintained such listing). The security types eligible for the Index include common stocks, ordinary shares, ADRs, shares of beneficial interest or limited partnership interests and tracking stocks. Security types not included in the Index are closed-end funds, convertible debentures, exchange traded funds, preferred stocks, rights, warrants, units and other derivative securities.
The Dow Jones Industrial Average® (The Dow®), is a price-weighted measure of 30 U.S. blue-chip companies. The index covers all industries except transportation and utilities.
The Russell 2000® Index measures the performance of the small-cap segment of the US equity universe. The Russell 2000® Index is a subset of the Russell 3000® Index representing approximately 10% of the total market capitalization of that index. It includes approximately 2,000 of the smallest securities based on a combination of their market cap and current index membership. The Russell 2000® is constructed to provide a comprehensive and unbiased small-cap barometer and is completely reconstituted annually to ensure larger stocks do not distort the performance and characteristics of the true small-cap opportunity set.
The MSCI EAFE Index is an equity index which captures large and mid-cap representation across 21 Developed Markets countries*around the world, excluding the US and Canada. With 902 constituents, the index covers approximately 85% of the free float-adjusted market capitalization in each country.
The MSCI Emerging Markets Index captures large and mid-cap representation across 26 Emerging Markets (EM) countries*. With 1,387 constituents, the index covers approximately 85% of the free float-adjusted market capitalization in each country.
The Bloomberg Barclays U.S. Aggregate Bond Index is a broad-based benchmark that measures the investment grade, U.S. dollar-denominated, fixed-rate taxable bond market. This includes Treasuries, government-related and corporate securities, mortgage-backed securities, asset-backed securities and collateralized mortgage-backed securities. ACA-2201-4.
