I’m starting with this chart because it matters:
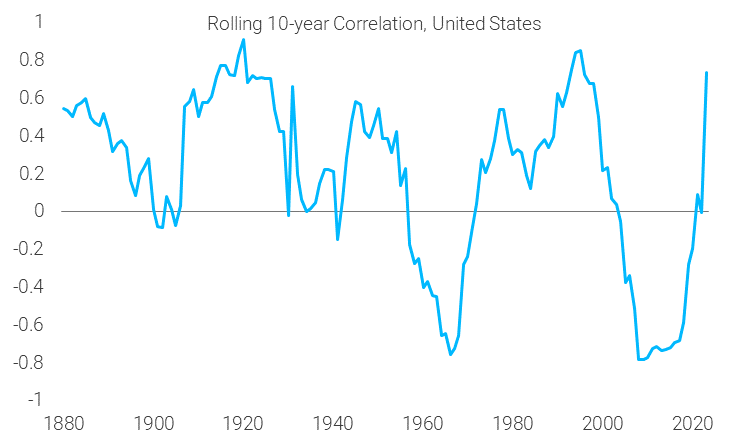
Source: TS Lombard as of March 2023
What you are looking at is the rolling 10-year correlation between stocks and bonds. Correlation is a measure of the relationship or connection between two things. In this case, the returns of stock and the returns of bonds.
2 points to make about what you see (there’s more I know):
- Correlations aren’t constant… they change.
- The recent rise from negative to positive…
That’s the What? of this chart. Before we get into the Why this matters discussion, let’s set the stage.
Hedges vs. Diversifiers
The two things are different. In fact, they are VERY different. Is it possible for a diversifier to act like a hedge? Yes, but just because it goes through periods of acting like a hedge, doesn’t make it one. That’s an issue we will discuss more.
The holy grail of portfolio construction would be to find different investments that all have the following characteristics:
- A Positive expected return
- Correlation of ZERO to the other investments around it
If you can find these investments, it wouldn’t take many of them to reduce and nearly eliminate all risk. I’ll spare you from any portfolio variance formulas, but I want to emphasize this point:
It’s the correlation of your holdings that impacts portfolio risk.
Remember, I’m assuming each holding has positive expected return for these next few sentences. Each individual holding can be extremely volatile as a standalone, but if its correlation is zero to the other holdings, its addition to the portfolio reduces overall risk. As you know, we could spend hours on the concept of volatility tax and why reducing it is critical when the goal is to compound capital.
So, what’s the easiest way to identify a hedge vs a diversifier…correlation risk! Diversifiers have it and hedges don’t.
A diversifier should be a holding that has positive expected returns that aren’t dependent on the same drivers of return as your other holdings. But, there’s correlation risk. Meaning, when stocks go down, your diversifiers may too. Again, correlations aren’t constant.
On the other hand, a hedge has ZERO correlation risk. If we hold the S&P 500 and buy a direct hedge on that, you have no correlation risk. Your returns of one will be negatively correlated to the other. What you do have is a negative expected return.
To summarize for clarity. A hedge is a negative expected return holding that carries zero correlation risk. A diversifier is a positive expected return holding with correlation risk.
Why the Chart Matters
The reason for driving home the point above is that in recent decades, bonds have fooled many investors into believing they are a portfolio hedge that also has positive returns.
If stocks were down, their bonds were up. That’s how the world seemed to work. Most of the portfolios we see are constructed with a dependency on this ‘truth’. We’d argue that the entire industry is built on this premise…that bonds serve as a hedge when needed, and produce positive returns on top of that.
The real truth is that this negative correlation the world is dependent on is not the norm. Just look at the chart we started with. More time was spent above the zero line in positive correlation territory than not.
In our opinion, the source of inflation weighs heavily on the correlation between stocks and bonds. Our outlook for inflation stickiness, even if it continues to slowly subside, is very different than the disinflationary world of the recent past.
Portfolio Impact
Rather than building portfolios with the hope of negative correlation between stocks and bonds to save the day, our focus is on using volatility to create optionality. Better in the tails is the mantra, and using volatility as an asset class is the path of execution.
We are using strategies to position based on the windshield and not the rearview. If the rearview repeats the correlation anomaly, we’ll be plenty happy with the outcome. But if conditions have changed and the recent map less useful, we’ll be happy to have prepared for a wider range of possibilities.
As always, thank you for your trust and please don’t hesitate to reach out.
Disclosures
Past performance is not indicative of future results. This material is not financial advice or an offer to sell any product. The information contained herein should not be considered a recommendation to purchase or sell any particular security. Forward looking statements cannot be guaranteed.
This commentary offers generalized research, not personalized investment advice. It is for informational purposes only and does not constitute a complete description of our investment services or performance. Nothing in this commentary should be interpreted to state or imply that past results are an indication of future investment returns. All investments involve risk and unless otherwise stated, are not guaranteed. Be sure to consult with an investment & tax professional before implementing any investment strategy. Investing involves risk. Principal loss is possible.
Advisory services are offered through Aptus Capital Advisors, LLC, a Registered Investment Adviser registered with the Securities and Exchange Commission. Registration does not imply a certain level or skill or training. More information about the advisor, its investment strategies and objectives, is included in the firm’s Form ADV Part 2, which can be obtained, at no charge, by calling (251) 517-7198. Aptus Capital Advisors, LLC is headquartered in Fairhope, Alabama. ACA-2306-21.