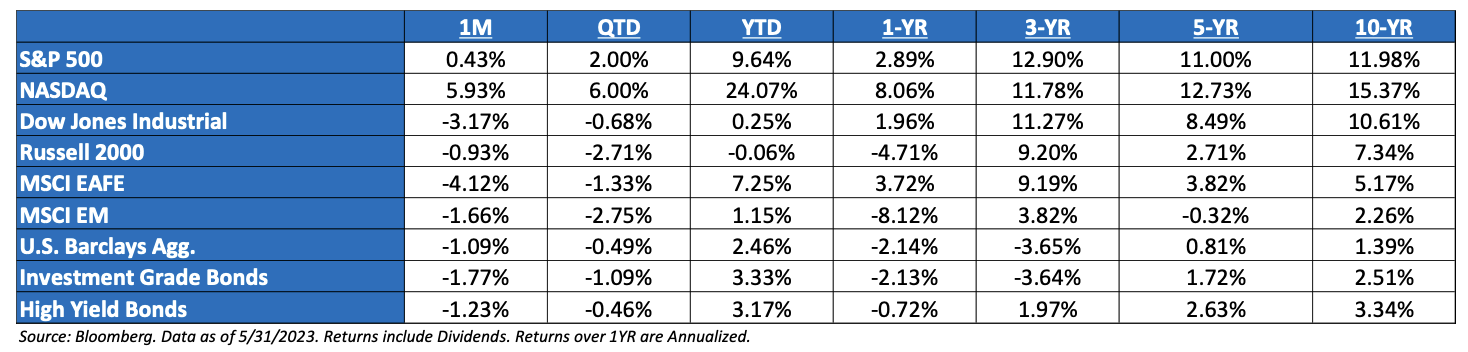
May ‘23 Market Recap: The S&P 500 gained 0.4% in May and traded in a 100pt range (4056 and 4169), one of the most narrow monthly ranges (11th percentile) in history since the 1930s. The VIX remained low as well. Only 23% of stocks outperformed the S&P 500, the lowest of any month in our data history since 1986. Five stocks added 2.4% to the index during the month. The other 495 stocks detracted 2.0% from the index. Basically, investors either owned technology exposure in May and made money, or you owned everything and you made no money. The equal-weighted index fell 4%. But history suggests weak breadth itself isn’t a precursor of market weakness.
Market Breadth: Reiterating some facts from above but wanting to make it clear that May had the worst trading breadth behind a monthly gain ever. A measly 23% of S&P 500 members are up on the month, but that’s just enough to light the Index higher in the month of May. By these measures, it’s the weakest breadth behind a monthly gain going back as far as the data allows (i.e., 1986). More importantly, there have only been five other months’ gains with breadth below 45% – and glancing at performance after, there’s no clear directional clue. So, while the superlative sounds interesting, history has yet to provide a clear trading signal.
Debt Ceiling Resolution: It looks like the Fiscal Responsibility Act (“FRA”) will be approved by the President before the “X-Date”. This Act would raise the debt limit through January 1, 2025, and caps discretionary spending increases for six years – though the first two years are the only years that have enforceable spending caps. The market took the debt ceiling resolution in stride, as it includes less discretionary cuts than originally expected, i.e., growth may be more insulated in the future. Focus will now turn to the debt market, as US Treasury Secretary Janet Yellen, starts to refill the Treasury General Account, which is basically the government’s checking account.
Earnings Season: Overall, economic data has been consistently stronger-than-expected leaving earnings to be better-than-anticipated. From a spending perspective, bank lending & deposit data have not confirmed the worst fears about a tightening of lending standards, and the economic data has been consistently better than feared. Strong and income growth continue to support spending and that’s what we saw in Q1. Basically, for now, economic trends don’t support heightened near-term recession risk. Q1 ’23 EPS tracked 5% better than Wall Street analysts expected, though down 3% YoY. Of that, 71% of companies beat on sales, 77% on earnings, 58% on both, handily clearing the long-term averages of 58% / 59% / 40%. At the beginning of the year, Q1 EPS expectations were thought to contract 8% YoY, reflecting reduced concerns about downside risk.
Jobs Update: Macro data is still mixed with no clear sign that a recession is imminent or that one can be avoided. The jobs picture paints an environment in which you can pick your own narrative. The Non-Farm Payroll number was stronger than anticipated. Yet, the unemployment rate went up to 3.7% from 3.4% as the household survey has showed job losses over the last 2 months in combination. Pick your survey methodology and get the narrative you want. More importantly, avg. hourly earnings continued to decelerate. Wage growth levels are only ~1% above wage growth levels of 2019, and it’s still coming down before the labor economy has even lost a job (allegedly).
The Fed Update: The Fed has raised their Federal Funds rate by 500 bps since March ‘22. The surprise for many has been that, up until the last couple of months, there hasn’t been material negative effects on both the real economy and financial markets, i.e., something “breaking”. It does appear the banking sector has finally begun to feel the pain of the hikes and inverted yield curve. We believe that continued stickier inflation could pin the Fed between a proverbial “rock and a hard place”, as policy makers would face the decision of either continuing the fight against stickier-than-expected inflation with aggressive policy, or risk sending the global financial system into another crisis as collateral damage increases.
What Concerns Us the Most: In short: 1) Continued volatility; 2) Inflation transitions to growth frustration; 3) The potential for a Fed policy error and continued collateral damage; 4) A general tendency to think about the economy and stock prices in V-shaped terms, i.e., a Fed Pivot saving the day.
S&P Valuation: After the recent rally, the S&P 500 P/E is closer to 19x than 18x, placing it in the statistically expensive category and is trading at a historical premium to every asset class except 10YR Treasury bonds (whose valuation it has been rapidly approaching). The S&P 500 premium converging with the bond premium is not a coincidence: the S&P 500 resembles a long duration, low coupon bond – its composition is dominated by mega cap, long term growth stocks that typically don’t pay dividends, but flourished during QE. Both asset classes will likely do well if real rates fall from here.
Earnings: ‘22 S&P 500 op. earnings = $219 (+7.4%). 2023 = $222 (+1.8%). 2021 = $204. 2020 = $136. 2019 = $161. *
Valuations: S&P 500 Fwd. P/E (NTM): 20.5x, EAFE: 13.3x, EM: 12.1x, R1V: 15.5x, R1G: 28.0x, and R2K: 15.1x.*
*Source: Bloomberg and FactSet, Data as of 5/31/23
Disclosures
Aptus Capital Advisors, LLC is a Registered Investment Advisor (RIA) registered with the Securities and Exchange Commission and is headquartered in Fairhope, Alabama. Registration does not imply a certain level of skill or training. For more information about our firm, or to receive a copy of our disclosure Form ADV and Privacy Policy call (251) 517-7198 or contact us here. Information presented on this site is for educational purposes only and does not intend to make an offer or solicitation for the sale or purchase of any securities.
This commentary offers generalized research, not personalized investment advice. It is for informational purposes only and does not constitute a complete description of our investment services or performance. Nothing in this commentary should be interpreted to state or imply that past results are an indication of future investment returns. All investments involve risk and unless otherwise stated, are not guaranteed. Be sure to consult with an investment & tax professional before implementing any investment strategy.
Past performance is not indicative of future results. This material is not financial advice or an offer to sell any product. The information contained herein should not be considered a recommendation to purchase or sell any particular security. Forward looking statements cannot be guaranteed.
The S&P 500® is widely regarded as the best single gauge of large-cap U.S. equities. There is over USD 11.2 trillion indexed or benchmarked to the index, with indexed assets comprising approximately USD 4.6 trillion of this total. The index includes 500 leading companies and covers approximately 80% of available market capitalization.
The Nasdaq Composite Index measures all Nasdaq domestic and international based common type stocks listed on The Nasdaq Stock Market. To be eligible for inclusion in the Index, the security’s U.S. listing must be exclusively on The Nasdaq Stock Market (unless the security was dually listed on another U.S. market prior to January 1, 2004 and has continuously maintained such listing). The security types eligible for the Index include common stocks, ordinary shares, ADRs, shares of beneficial interest or limited partnership interests and tracking stocks. Security types not included in the Index are closed-end funds, convertible debentures, exchange traded funds, preferred stocks, rights, warrants, units and other derivative securities.
The Dow Jones Industrial Average® (The Dow®), is a price-weighted measure of 30 U.S. blue-chip companies. The index covers all industries except transportation and utilities.
The Russell 2000® Index measures the performance of the small-cap segment of the US equity universe. The Russell 2000® Index is a subset of the Russell 3000® Index representing approximately 10% of the total market capitalization of that index. It includes approximately 2,000 of the smallest securities based on a combination of their market cap and current index membership. The Russell 2000® is constructed to provide a comprehensive and unbiased small-cap barometer and is completely reconstituted annually to ensure larger stocks do not distort the performance and characteristics of the true small-cap opportunity set.
The MSCI EAFE Index is an equity index which captures large and mid-cap representation across 21 Developed Markets countries*around the world, excluding the US and Canada. With 902 constituents, the index covers approximately 85% of the free float-adjusted market capitalization in each country.
The MSCI Emerging Markets Index captures large and mid-cap representation across 26 Emerging Markets (EM) countries*. With 1,387 constituents, the index covers approximately 85% of the free float-adjusted market capitalization in each country.
Investment-grade Bond (or High-grade Bond) are believed to have a lower risk of default and receive higher ratings by the credit rating agencies. These bonds tend to be issued at lower yields than less creditworthy bonds.
Non-investment-grade debt securities (high-yield/junk bonds) may be subject to greater market fluctuations, risk of default or loss of income and principal than higher-rated securities.
Nasdaq-100® includes 100 of the largest domestic and international non-financial companies listed on the Nasdaq Stock Market based on market capitalization.
The Bloomberg Barclays U.S. Aggregate Bond Index is a broad-based benchmark that measures the investment grade, U.S. dollar-denominated, fixed-rate taxable bond market. This includes Treasuries, government-related and corporate securities, mortgage-backed securities, asset-backed securities, and collateralized mortgage-backed securities. ACA-2306-5.
