
March ‘24 Market Recap: The S&P 500 returned 10.6% in Q1, on a combination of two very powerful forces; dovish central banks and a continued broadening of the AI narrative. The S&P 500 rallied for the fifth straight month in March (a 99th percentile return, in fact since the lows of October). The recent market has witnessed a rally in everything except one asset class – bonds.
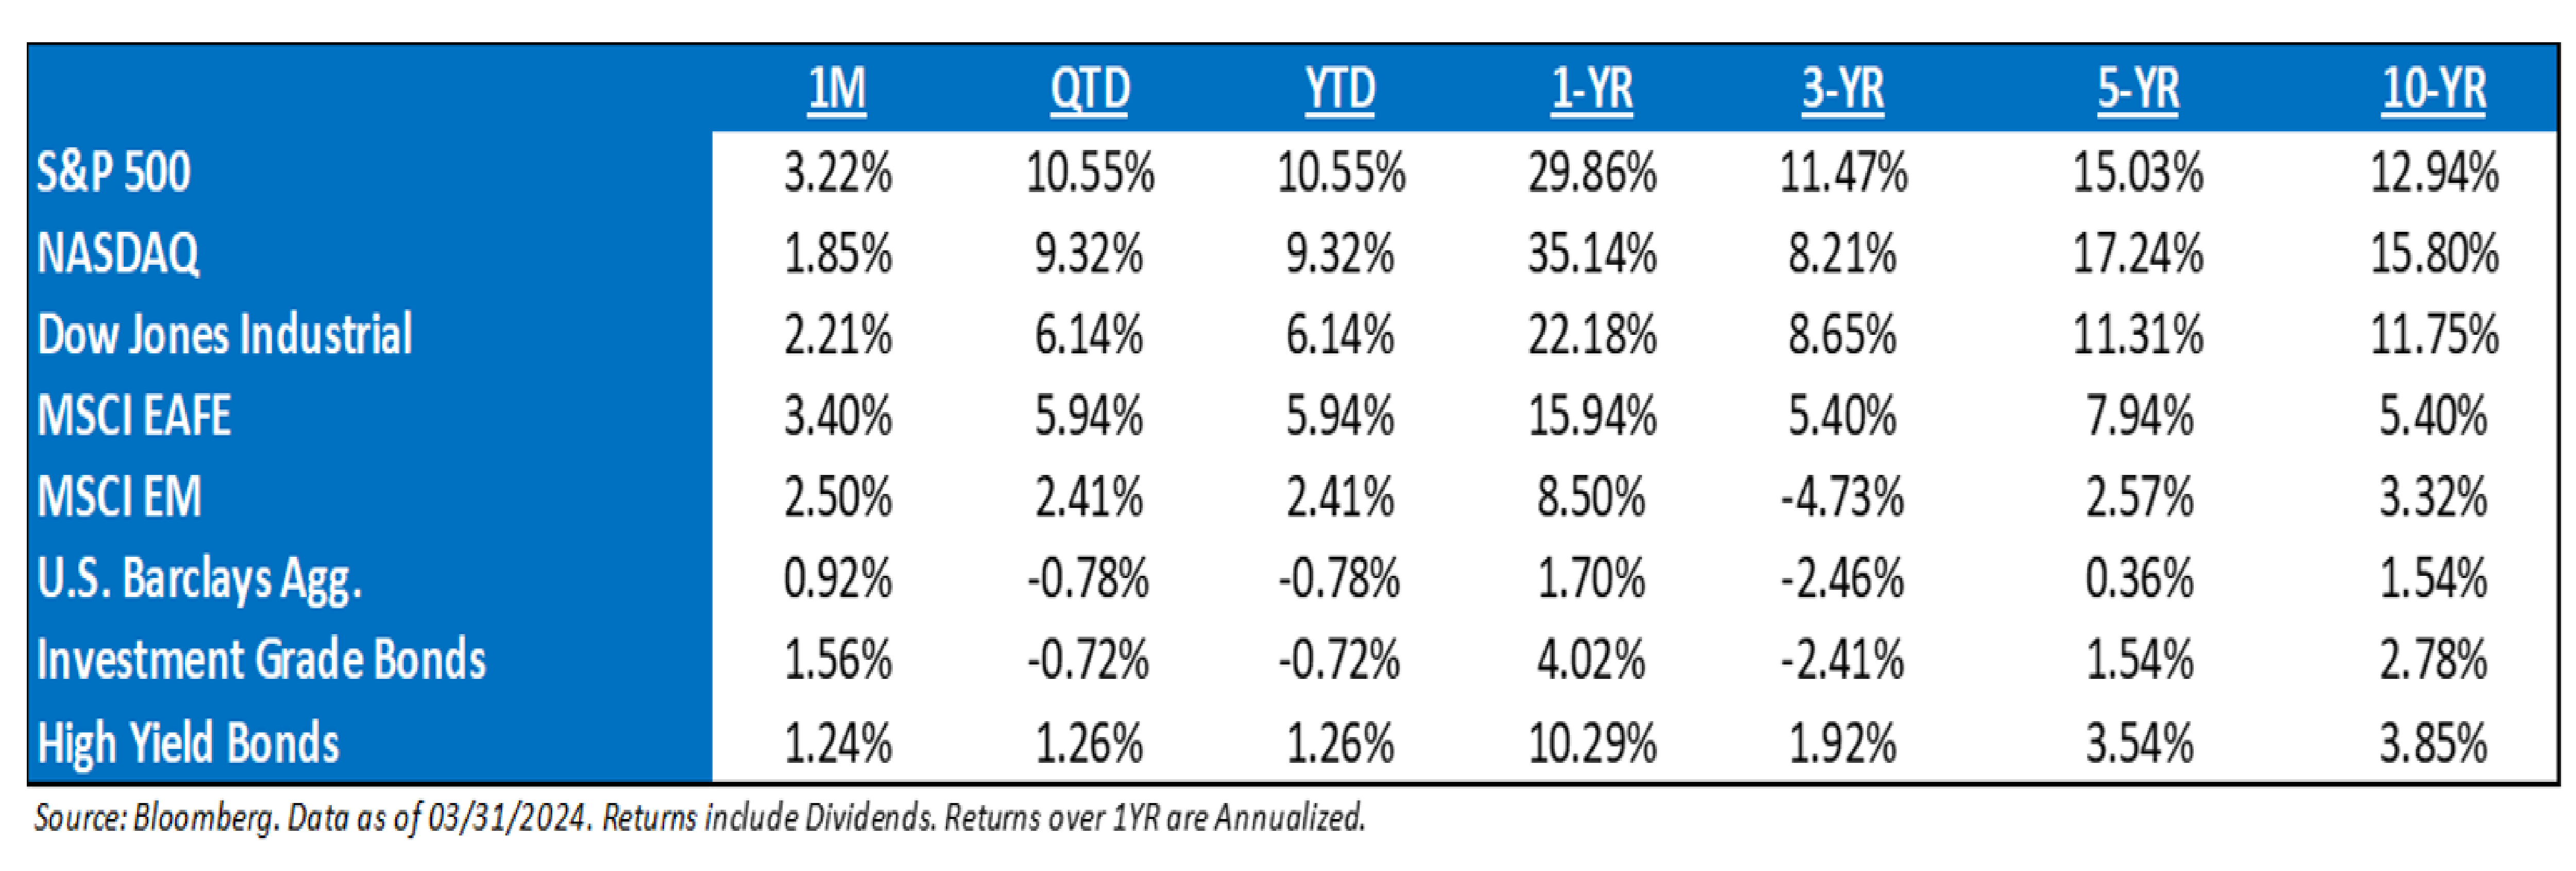
Moving Forward, It’s All About Growth: Inflation around 3% isn’t a threat to the market or economy by itself, but the Fed’s response to that sticky inflation could be to keep rates “higher for longer” and the impact of that will be increased chances for an economic slowdown—which remains a real risk to this rally. Bottom line, focus on growth. Growth is the rally killer.
The Market Loves Themes: This year has seen a very strong year for ‘thematics’ as the promise of rate cuts (and/or a no landing scenario) has allowed investors to focus on what can go ‘right’ in this equity market (compared to a range-bound rates market and trendless small caps) – stand-out themes this year have been: A.I., GLP-1, Energy & Infrastructure, Japan, Onshoring, et al. While no reason to expect an immediate change here, worth noting that valuations are less favorable than they once were, and it is possible that this multi-theme market eventually gets replaced by a singularly themed market (the US Election) into the 2H of the year.
History Suggests that it is Too Soon to Fade Equities: While in the near term it wouldn’t surprise us if equity markets pulled back, history would suggest that it’s too soon to fade equities. With the S&P up +27% in the five months off the October low, we looked back at the previous five-month periods where the S&P was up also +27%. Of the 130 observations, there was just one that resulted in a negative return 12 months later. Furthermore, the average 12-month return of all the observations was 15%.
Markets to begin 2024: A word of caution about the ’24 market rally (the S&P 500 is +10.6% YTD). The equity market seems as convinced about a soft landing today as it was convinced of a recession in 2022. In both cases, the short-term lesson is not to stand in the way of a market that wants to express an opinion, while the longer-term lesson is that the economy is a tortoise, and no matter the conviction level the equity market wants to have, the economy will take longer than most think to reveal its ultimate answer.
The Fed and What the Market is Saying: In sum, the Fed has no choice but to wait to see how the data come out. Economies do not slow with strong employment growth and new homes running closer to 700,000 than 600,000 – the long-term median. If there are no cuts, however, this is not necessarily bad news for the markets as it is a signal of sustained growth. The equity market is already relaying that signal.
Earnings Estimates Remain Steady, 2025 Growth Greater Than 2024 For Now: Earnings continue to muddle sideways as we sit between the end of one reporting season and wait for the next to begin. At $243.63 for 2024, the consensus is expecting earnings to grow 10.7%. What remains encouraging for equities is that 2025 growth is expected to be 13.3%. We are viewing the acceleration of growth expected next year as a positive for market fundamentals at the moment. Another positive for the fundamentals is that operating margins continue to expand, now sitting at 16.9%. This is the highest level going back to 2008 outside of the post-covid recovery. As long as margins are expanding the market doesn’t often get into too much trouble. It’s when they begin to roll over that more caution is warranted.
The Presidential Election Year: Since ‘52, the S&P 500 has not declined in a year in which an incumbent president was running for re-election (avg. return of 10%). Stocks have declined in presidential election years, but in each of those cases it was a year in which there was an open election with no incumbent running (‘60, ‘00, and ‘08). Presidents want to be re-elected and will use whatever policy levers are needed to boost the US economy. In fact, every president who avoided a recession two years before their re-election went on to win election. And every president who had a recession in the two years before their re-election went on to lose.
Earnings: ‘24 S&P 500 EPS = $244 (+10.7%). 2023 = $220 (+0.5%). 2022 = $219 (+7.4%). 2021 = $204. 2020 = $136. *
Valuations: S&P 500 Fwd. P/E (NTM): 21.2x, EAFE: 14.8x, EM: 12.1x, R1V: 16.5x, and R1G: 27.7x. *
*Source: Bloomberg and FactSet, Data as of 03/31/24
Disclosures
Aptus Capital Advisors, LLC is a Registered Investment Advisor (RIA) registered with the Securities and Exchange Commission and is headquartered in Fairhope, Alabama. Registration does not imply a certain level of skill or training. For more information about our firm, or to receive a copy of our disclosure Form ADV and Privacy Policy call (251) 517-7198 or contact us here. Information presented on this site is for educational purposes only and does not intend to make an offer or solicitation for the sale or purchase of any securities.
This commentary offers generalized research, not personalized investment advice. It is for informational purposes only and does not constitute a complete description of our investment services or performance. Nothing in this commentary should be interpreted to state or imply that past results are an indication of future investment returns. All investments involve risk and unless otherwise stated, are not guaranteed. Be sure to consult with an investment & tax professional before implementing any investment strategy.
Past performance is not indicative of future results. This material is not financial advice or an offer to sell any product. The information contained herein should not be considered a recommendation to purchase or sell any particular security. Forward looking statements cannot be guaranteed.
The S&P 500® is widely regarded as the best single gauge of large-cap U.S. equities. There is over USD 11.2 trillion indexed or benchmarked to the index, with indexed assets comprising approximately USD 4.6 trillion of this total. The index includes 500 leading companies and covers approximately 80% of available market capitalization.
The Nasdaq Composite Index measures all Nasdaq domestic and international based common type stocks listed on The Nasdaq Stock Market. To be eligible for inclusion in the Index, the security’s U.S. listing must be exclusively on The Nasdaq Stock Market (unless the security was dually listed on another U.S. market prior to January 1, 2004 and has continuously maintained such listing). The security types eligible for the Index include common stocks, ordinary shares, ADRs, shares of beneficial interest or limited partnership interests and tracking stocks. Security types not included in the Index are closed-end funds, convertible debentures, exchange traded funds, preferred stocks, rights, warrants, units and other derivative securities.
The Dow Jones Industrial Average® (The Dow®), is a price-weighted measure of 30 U.S. blue-chip companies. The index covers all industries except transportation and utilities.
The MSCI EAFE Index is an equity index which captures large and mid-cap representation across 21 Developed Markets countries*around the world, excluding the US and Canada. With 902 constituents, the index covers approximately 85% of the free float-adjusted market capitalization in each country.
The MSCI Emerging Markets Index captures large and mid-cap representation across 26 Emerging Markets (EM) countries*. With 1,387 constituents, the index covers approximately 85% of the free float-adjusted market capitalization in each country.
Investment-grade Bond (or High-grade Bond) are believed to have a lower risk of default and receive higher ratings by the credit rating agencies. These bonds tend to be issued at lower yields than less creditworthy bonds.
Non-investment-grade debt securities (high-yield/junk bonds) may be subject to greater market fluctuations, risk of default or loss of income and principal than higher-rated securities.
Nasdaq-100® includes 100 of the largest domestic and international non-financial companies listed on the Nasdaq Stock Market based on market capitalization.
The Bloomberg Barclays U.S. Aggregate Bond Index is a broad-based benchmark that measures the investment grade, U.S. dollar-denominated, fixed-rate taxable bond market. This includes Treasuries, government-related and corporate securities, mortgage-backed securities, asset-backed securities, and collateralized mortgage-backed securities. ACA-2404-02.