The pace of change these days, whether it’s technology or geopolitics, is absolutely stunning: Maduro, Greenland, Venezuela, Lisa Cook, Powell, etc. The factors, the stocks, the sectors, are moving at warp speed under the S&P 500. In a nutshell, financial assets are open market referendums for debating and weighing the key issues of the day. The month of January has been a case study for all of this, containing elements of both elation and anxiety. Personally, I actually think we are seeing more rate volatility enter the equity market, but that baton will get passed to earnings season’s results very soon.
Last Year’s Superlatives
-
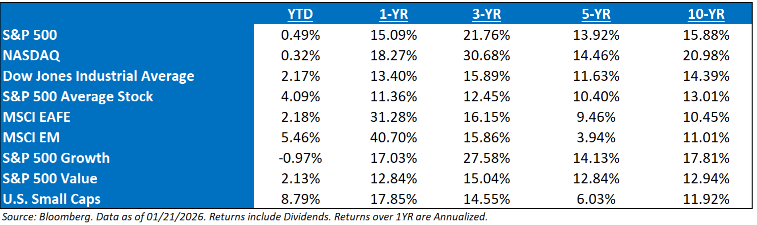
- International stocks reversed a 16-year trend of US outperformance in 2025.
-
- The S&P 500 Index has outperformed the S&P 500 Equal Weight Index by 34% over the past 3 years, the widest 3-year performance gap in history. The prior record was 32% outperformance from 1997-1999, which was followed by a sharp reversal and 7 years of Equal Weight outperformance.
-
- US Large Caps (S&P 500) outperformed US Small Caps (Russell 2000) by 5% in 2025, their 5th straight year of outperformance. That ties 1994-1998 for the longest streak of Large Cap outperformance ever. That prior streak was followed by 6 straight years of Small Cap outperformance (1999-2004).
-
- Growth stocks outperformed Value stocks by 3% in 2025, their third straight year of outperformance and a record eighth year of outperformance in the past nine. The ratio of Growth to Value has surpassed the March 2000 bubble peak.
Now, where are we year-to-date?
Reach out or hit our Content Hub if you’re interested in any of our Q4 2025 material (newsletter, webinar, chartbook, Market Outlook).
Onward… hopefully upward. Let me know if anyone has any ideas for a future Musing.
S&P 500 Q4 2025 Earnings Preview
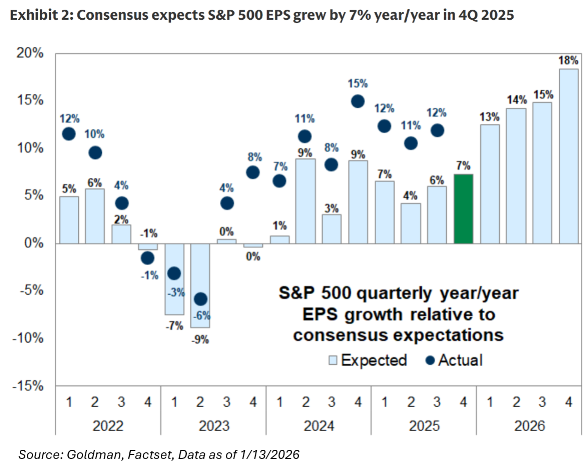
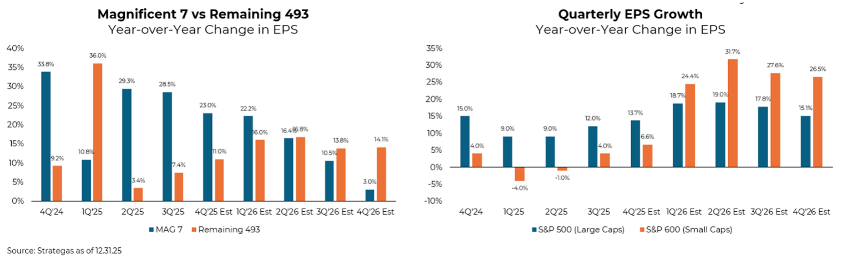
The S&P 500 has beaten quarterly YoY consensus expectations every single quarter since Q1 of 2023, and the setup feels like it’s laying the groundwork for another. Wall Street “experts” expect S&P 500 EPS growth of 7% YoY in Q4 2025, but this forecast appears too conservative once again. S&P 500 EPS grew by 10% or more during each of the first three quarters of 2025, exceeding analyst estimates by an average of 6%.
My conviction rings even deeper when analysts are expecting revenue growth of 6%. And if anyone has read any of our work, the S&P 500 is ingrained with operating leverage, so it’s difficult for me to reconcile revenue growth of 6% and EPS growth of only 7% on a YoY basis. That’s basically saying that Technology is not going to be growing during the quarter – unlikely (Tech. estimates appear to be +13% YoY). Then, take into consideration the recent jump in GDP that the market has witnessed. Forecasts point to nominal GDP growth above 5% during Q4, similar to the growth rate in Q3.
So, that begs the question, will the conservative expectations live up to current investor expectations? Only time will tell.
Here are the three major macro items that we’ll be focusing on:
1. We’ll be focused on what companies are saying about their headcount and hiring plans. While initial jobless claims remain stable, there’s growing concern about labor market softness.
2. The second key area will be AI spending trends. Technology has hit a bit of a stall lately, and if the sector is going to continue its upward momentum, we’ll need to see some positive news on the spending front. The AI “darlings” of 2025 seem to have taken a backseat for now, and it’s unclear who will step up to lead the charge.
3. The third area to watch will be consumer spending trends. We’ve been strong advocates for the idea of continued consumer spending, and now that 2026 is here, it’s time to see that play out in the numbers.
Hitting more in depth on point #2, Consensus estimates show hyperscaler YoY capex growth slowing from 75% in Q3 to 54% in Q4 and to 24% by the end of 2026. We expect upward revisions to these estimates, but believe capex growth will indeed decelerate in 2026. Evidence of the earnings impact of enterprise AI adoption will remain a key investor focus this season.
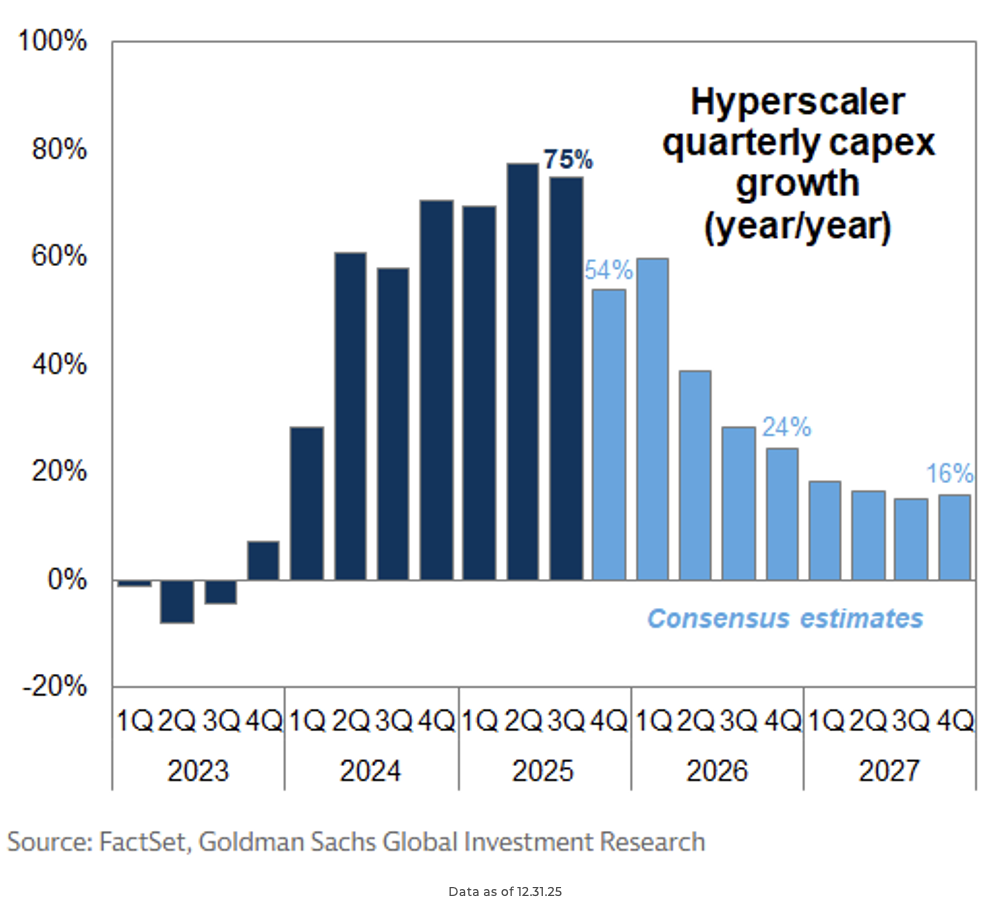
Even with this capex spending strength, markets are struggling to price a technology that is advancing at an exponential rate. While markets appear undeterred, even with solid fundamentals, they can still have a correction. We believe there is a difference between a bubble and an air pocket. While we don’t believe that we are currently in the former, the latter is a possibility. The boom in tech stocks and AI spending could lose its luster, even if temporarily. While few doubt the potential transformative impact of AI, a shift in momentum could be triggered by a range of factors (i.e., a miss on mega cap earnings, a supply crunch on power or critical materials, or an external liquidity shock). Given the significance of AI investment, such a slowdown could cause a swift pullback in the overall market, or at a minimum, pressure the AI-linked wealth gains that have lifted consumption.
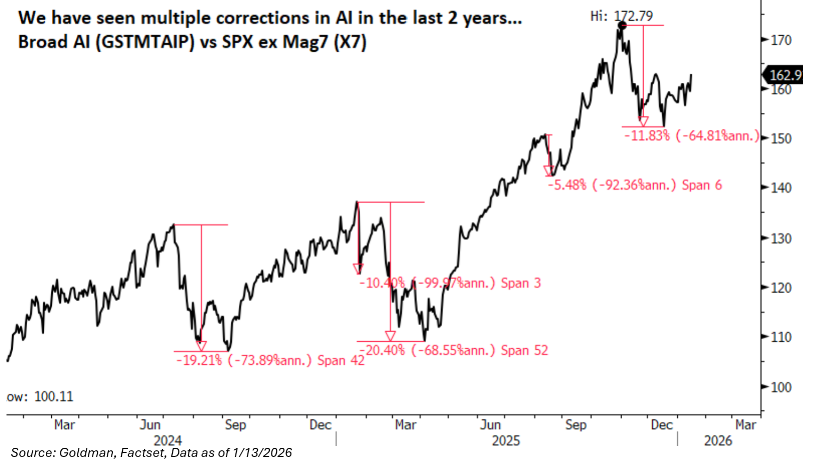
It should be noted that maybe there is some pessimism already priced into this corner of the market. We have seen multiple corrections in the AI ecosystem over the past few years. The last correction lasted a little over thirty days, where Goldman Sachs’ Broad AI basket (GSTMTAIP) underperformed the SPX Index, excluding the Mag7 (X7) by ~12%. This is not the worst correction we have seen in the last 2 years, and we have not fully recovered yet. Valuations are definitely more palatable entering 2026.
Given the broadening out of the market so far in 2026, we’ll look at earnings growth in each market; capitalization cohort. At the top, consensus expects 20% EPS growth for mega-cap tech vs. just 3% for the S&P 493. If realized, this would represent a sequential rebound from the 17% pace reported in Q3. However, Q3 results were affected by META’s one-time non-cash income tax charge. Excluding this charge, Q3 growth for the group registered 28%, signaling an expected deceleration in Q4.
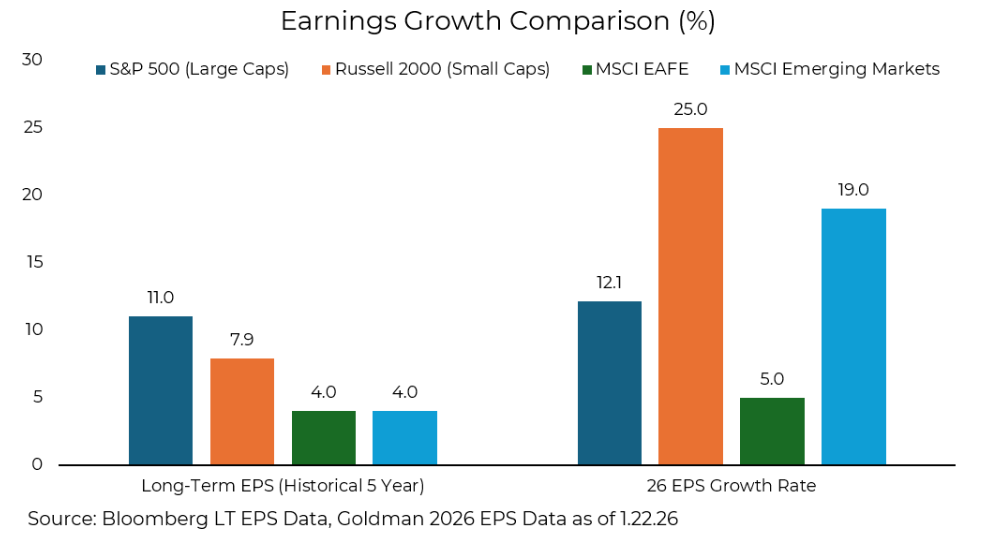
Lastly, I know I’m going to get some questions on this chart below—give ’em to me—it behooves us to critically think through proper Intl. weights. It’s the best graphic that our team could put together, but I’m always skeptical of some of the international numbers, as I tend to think they’re too high. Coincidentally, Brad Rapking, CFA, and I had a conversation today on this chart, and we stated our heavy displeasure at how it’s difficult to get reliable earnings growth numbers for international benchmarks; they’re highly variable amongst sources. I’d say this chart tends to show some more optimistic figures. Please note that Taiwan Semiconductor (TSM) is 12.5% of the EM benchmark and is expected to grow earnings in 2026 at a 31.4% clip, contributing almost 4% EPS growth to the MSCI EM Index.
I’m going to make it my civic duty to figure out more reliable numbers moving forward.
As everyone knows, given our allocation, we remain very pro-U.S. assets, which is also described in our Aptus Market Outlook: Be an American Psycho.
Please reach out if you have any questions.
Disclosures
Past performance is not indicative of future results. This material is not financial advice or an offer to sell any product. The information contained herein should not be considered a recommendation to purchase or sell any particular security. Forward looking statements cannot be guaranteed.
This commentary offers generalized research, not personalized investment advice. It is for informational purposes only and does not constitute a complete description of our investment services or performance. Nothing in this commentary should be interpreted to state or imply that past results are an indication of future investment returns. All investments involve risk and unless otherwise stated, are not guaranteed. Be sure to consult with an investment & tax professional before implementing any investment strategy. Investing involves risk. Principal loss is possible.
Advisory services are offered through Aptus Capital Advisors, LLC, a Registered Investment Adviser registered with the Securities and Exchange Commission. Registration does not imply a certain level of skill or training. More information about the advisor, its investment strategies and objectives, is included in the firm’s Form ADV Part 2, which can be obtained, at no charge, by calling (251) 517-7198. Aptus Capital Advisors, LLC is headquartered in Fairhope, Alabama. ACA-2601-33.
