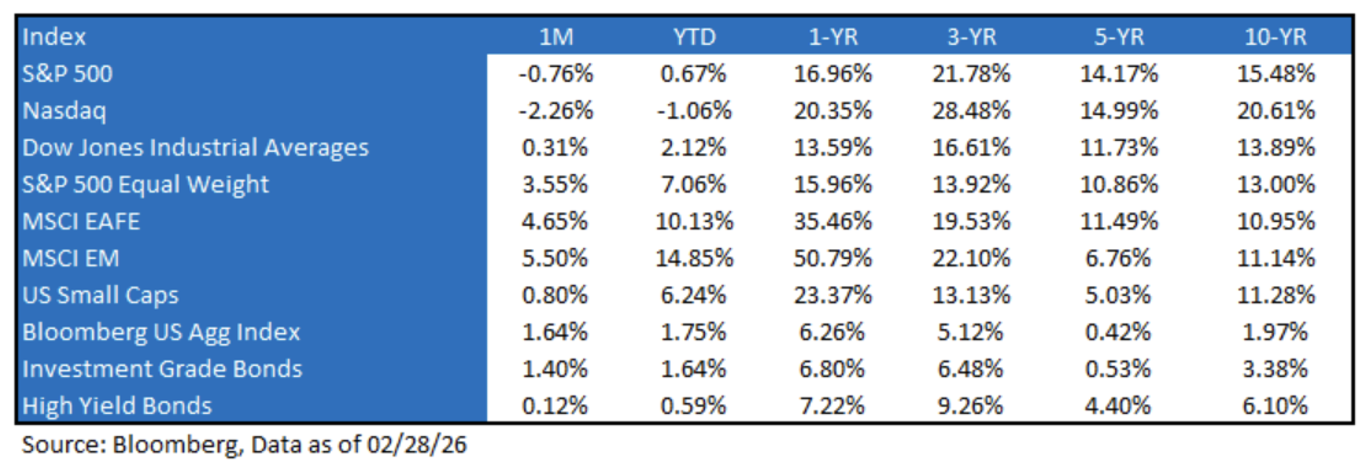
Market Recap → A Theme of Disintermediation: Headline returns for the index remained somewhat muted during February; however, underneath the hood from a single stock standpoint, we witnessed a lot of turbulence. This market chop was characterized by a significant shift in investor sentiment as the “AI trade” faced its first major reality check of the year. While January’s momentum initially carried over, the S&P 500 and Nasdaq Composite ultimately posted their steepest monthly percentage declines in roughly a year, falling -0.76% and -2.26% respectively. The primary catalyst was a “risk-off” rotation triggered by skepticism over massive AI capital expenditures and fears of industry displacement, even with “stellar” earnings across the board.
Market volatility was further exacerbated by geopolitical instability alongside a domestic policy shift as Trump ramped up tariffs to 10% following a Supreme Court ruling. Despite the tech-heavy slump, the average stock, alongside U.S. small caps, remained relatively resilient, buoyed by a rotation into defensive and cyclical sectors like Energy, Industrials, and Consumer Staples, which helped the broader market avoid a total retreat.
The Market During Geopolitical Events: We never know what we don’t know. But what we do know is that an open mind, an imagination, and following what the market is telling you is one of the best skillsets there is to navigate the unknown. Consider the last few weeks: Venezuela, SCOTUS ruling, AI-apocalypse, and now the breakout of war – yet the market has been very resilient. Historically, US markets are generally resilient to geopolitical conflicts. While the list of these events isn’t exhaustive (investors can likely only point to 14 events over the last few decades), the S&P 500 tends to be range-bound during the start of a conflict. The event causing the largest drawdown was on September 11, 2001. Yet, despite the dramatic headlines of the Iranian attack, the main influence on stocks remains AI Anxiety, and barring any further escalation in the Iran conflict, that will remain the case.
Now, clearly, the conflict isn’t positive for markets, and it does add to already rising investor concerns. And at a minimum, we can expect more volatility, near-term. However, at its current state, the Iran conflict is not a bearish game-changer (despite any short-term drop), and the medium-term direction of this market is still being determined by 1) AI sentiment, 2) Economic growth, and 3) Fed rate-cut expectations.
The Markets Will Continue to Pay the Troll Toll of Tariffs: Trump has clearly telegraphed the plans for the future tariffs after SCOTUS deemed the IEEPA tariffs illegal. These alternative tariff authorities that Trump had to choose from come with various procedural, timing, and rate-related constraints, bringing some potential variability to rates in the interim; however, long-term, tariffs are here to stay, and that should be the key takeaway from this event.
Section 122 + Section 301: Use of Section 122 to impose immediate tariffs of up to 15% on trading partners with whom the U.S. maintains a trade deficit. During the 150-day time limit, the administration conducts Section 301 (country-specific) investigations; at the conclusion, the Section 301 tariffs go into effect. Section 301 does not have time limits or rate caps. This avenue would likely be more legally durable, but more procedurally complex.
Section 338: Use of a largely unused 1930s statute that allows the president to unilaterally declare tariffs to respond to “unreasonable” policies that discriminate against commerce of the U.S., up to a maximum rate of 50%. Given the lack of precedent, it is unclear to what extent a formal investigation is required. This approach is viewed as more legally shaky/unprecedented, but would likely allow the president to move more quickly.
Are We in an AI Bubble? Only time will tell if we are in a bubble, but let’s frame this question differently. Fears of asset bubbles popping have been drilled into every investor’s head since the “tulipmania” of the 1630s. Specifically, we’re taught that all booms lead to busts. But are all frenzies bad? Bubbles both create and destroy wealth.
Perhaps a more nuanced approach is needed. Many modern technologies were accompanied by overenthusiastic investment (railroads, cars, airlines, computers). So, is there a way to do a cost-benefit analysis, rather than just a cost analysis, on bubbles? The key lies in what the boom produces and how it is financed. The worst possible kind of bubble is a bubble in unproductive assets (gold, land, tulips) financed by banks. The best possible kind of bubble (i.e., one that does not hurt growth too badly) is a bubble in productive assets, financed by capital markets. The Japanese bubble of the late 1980s and the US real estate bubble of the mid-2000s were ‘bad’ bubbles. By contrast, the “dot.com” bubble of the late 1990s was a ‘good’ bubble. A bubble in a productive asset financed by equity can work out without too much trouble (equity is known to be a “risky” asset). There’s a short-term cost, but a long-term benefit (i.e., a new technology).
What to Focus on Right Now: When markets feel like they’re chaotic, remember to focus on the basics, i.e., economic growth.
Profit Growth Continues to Trend Higher: With Q4 earnings season now in the rear view, the fundamental backdrop for equities remains supportive as investors navigate a mid-term election year. As of the end of February, the next twelve-month earnings growth stands at 14.3%, the highest level since January 2025. If there’s one area of fundamental risk, it’s the continued concentration within the index – it can drive markets higher or lower. The top 10 companies now account for about one-third of total net income, meaning a miss from any major large-cap contributors could materially affect the overall earnings outlook. For now, though, growth remains robust.
Understanding the 2026 Narrative: Today’s narrative largely centers on two themes: continued AI-related capital expenditures, albeit at a slower pace, and the potential for an economic reacceleration supported by fiscal stimulus and Federal Reserve policy. While AI Capex growth will naturally moderate after such outsized investment levels, a key question is whether companies that issue debt to fund this spending will continue to receive the same valuation multiples they enjoyed earlier in the cycle. As for the prospect of an economic reacceleration, the question now is whether consumer momentum can be sustained through year-end before the fiscal stimulus starts to take effect in 2026.
S&P 500 EPS: ’26 (Exp.) EPS = $312.72 (+15.1%). ’25 (Exp.) EPS = $271.80 (+10.9%). ‘24 EPS = $245.16 (+11.5%). 2023 = $220 (+8.6%). 2022 = $219 (+0.5%).
Valuations: S&P 500 Fwd. P/E (NTM): 22.0x, NASDAQ: 26.5x, EAFE: 14.5x, EM: 11.9x, R1V: 17.3x, and R1G: 28.6x. *
*Source: Bloomberg and FactSet, Data as of 02/28/2026
Disclosures
Aptus Capital Advisors, LLC is a Registered Investment Advisor (RIA) registered with the Securities and Exchange Commission and is headquartered in Fairhope, Alabama. Registration does not imply a certain level of skill or training. For more information about our firm, or to receive a copy of our disclosure Form ADV and Privacy Policy call (251) 517-7198 or contact us here. Information presented on this site is for educational purposes only and does not intend to make an offer or solicitation for the sale or purchase of any securities.
This commentary offers generalized research, not personalized investment advice. It is for informational purposes only and does not constitute a complete description of our investment services or performance. Nothing in this commentary should be interpreted to state or imply that past results are an indication of future investment returns. All investments involve risk and unless otherwise stated, are not guaranteed. Be sure to consult with an investment & tax professional before implementing any investment strategy.
Past performance is not indicative of future results. This material is not financial advice or an offer to sell any product. The information contained herein should not be considered a recommendation to purchase or sell any particular security. Forward-looking statements cannot be guaranteed.
The S&P 500® is widely regarded as the best single gauge of large-cap U.S. equities. There is over USD 11.2 trillion indexed or benchmarked to the index, with indexed assets comprising approximately USD 4.6 trillion of this total. The index includes 500 leading companies and covers approximately 80% of available market capitalization.
The Nasdaq Composite Index measures all Nasdaq domestic and international-based common type stocks listed on The Nasdaq Stock Market. To be eligible for inclusion in the Index, the security’s U.S. listing must be exclusively on The Nasdaq Stock Market (unless the security was dually listed on another U.S. market prior to January 1, 2004 and has continuously maintained such listing). The security types eligible for the Index include common stocks, ordinary shares, ADRs, shares of beneficial interest or limited partnership interests and tracking stocks. Security types not included in the Index are closed-end funds, convertible debentures, exchange traded funds, preferred stocks, rights, warrants, units and other derivative securities.
The Dow Jones Industrial Average® (The Dow®), is a price-weighted measure of 30 U.S. blue-chip companies. The index covers all industries except transportation and utilities.
The MSCI EAFE Index is an equity index which captures large and mid-cap representation across 21 Developed Markets countries*around the world, excluding the US and Canada. With 902 constituents, the index covers approximately 85% of the free float-adjusted market capitalization in each country.
The MSCI Emerging Markets Index captures large and mid-cap representation across 26 Emerging Markets (EM) countries*. With 1,387 constituents, the index covers approximately 85% of the free float-adjusted market capitalization in each country.
Investment-grade Bond (or High-grade Bond) are believed to have a lower risk of default and receive higher ratings by the credit rating agencies. These bonds tend to be issued at lower yields than less creditworthy bonds.
Non-investment-grade debt securities (high-yield/junk bonds) may be subject to greater market fluctuations, risk of default or loss of income and principal than higher-rated securities.
Nasdaq-100® includes 100 of the largest domestic and international non-financial companies listed on the Nasdaq Stock Market based on market capitalization.
The Bloomberg Barclays U.S. Aggregate Bond Index is a broad-based benchmark that measures the investment grade, U.S. dollar-denominated, fixed-rate taxable bond market. This includes Treasuries, government-related and corporate securities, mortgage-backed securities, asset-backed securities, and collateralized mortgage-backed securities. ACA-2603-6.
