Well, there’s no sugarcoating this one; the first U.S. Presidential Election Debate for the current race will occur later this week. This event will likely jumpstart an onslaught of client questions regarding the election and its effect on the market. Over the next 4 months, I’ll have a slew of musings, specifically geared towards tackling these questions with market facts.
Let’s set the stage.
Four years ago, when I wrote up my election musings, I used a few simple indicators that could help investors gauge the potential outcome of the election, by simply looking at what the market is predicting/stating. I’ll continue to keep track of these factors, beginning in August (3 months before the election):
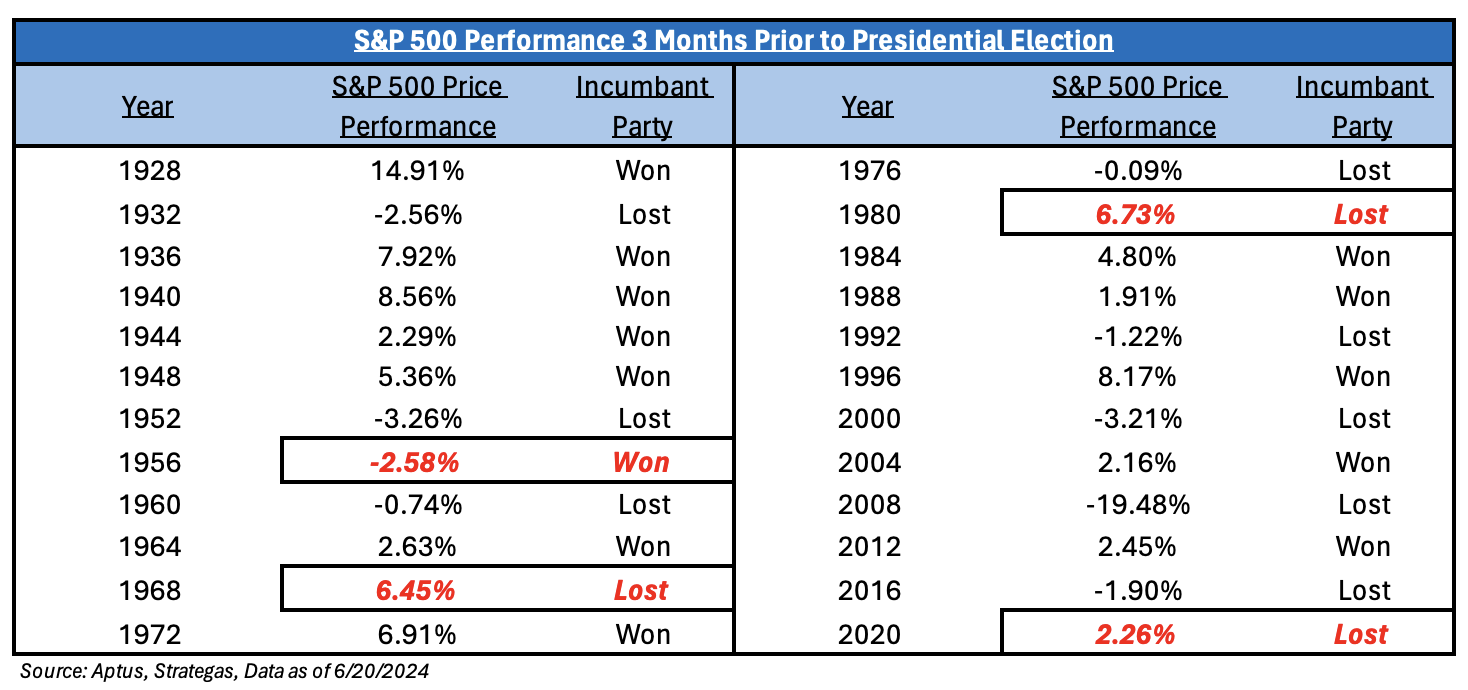
- The S&P 500 is higher in the 3-month period preceding the election = Incumbent Win
- USD Decline in the 3 months before an election = Incumbent Win
- GDP Expansion = Incumbent Win
- Gallup President Approval Rating > 50% = Incumbent Win
Truthfully, I don’t believe that the market starts to focus on the election until after Labor Day which is why a lot of the above indicators only focus on the 3 months preceding the election. Secondly, market volatility levels tell you the same thing:
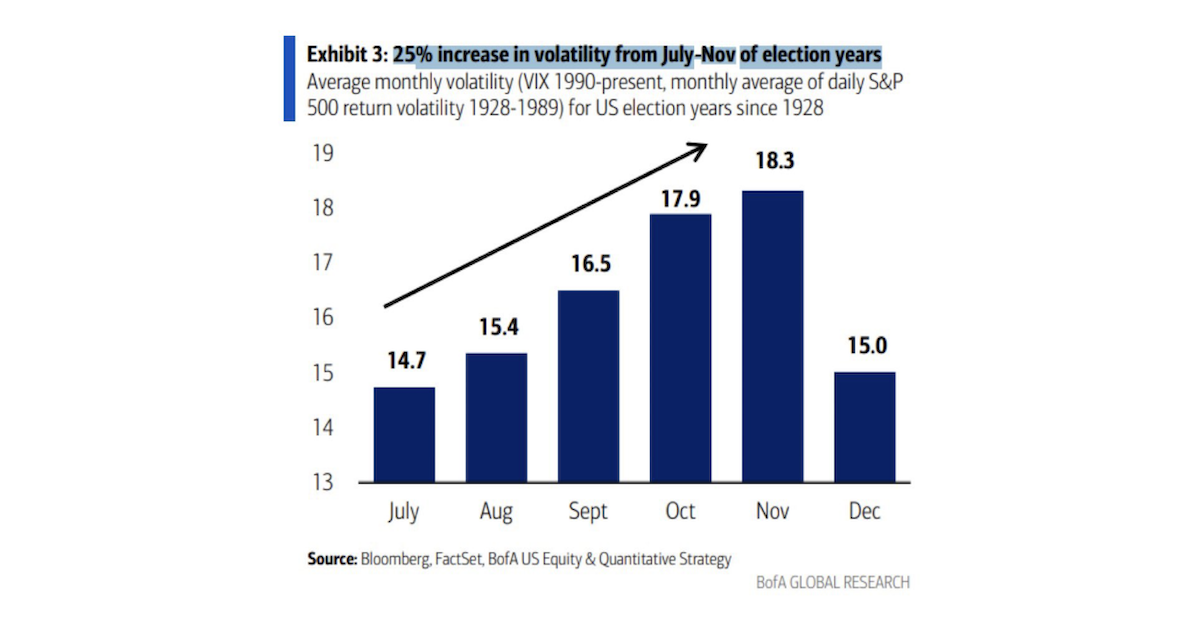 Source: BofA as of 06.15.2024
At the end of the day, sentiment for next year will likely be influenced by elections, not just in the U.S., but around the world.
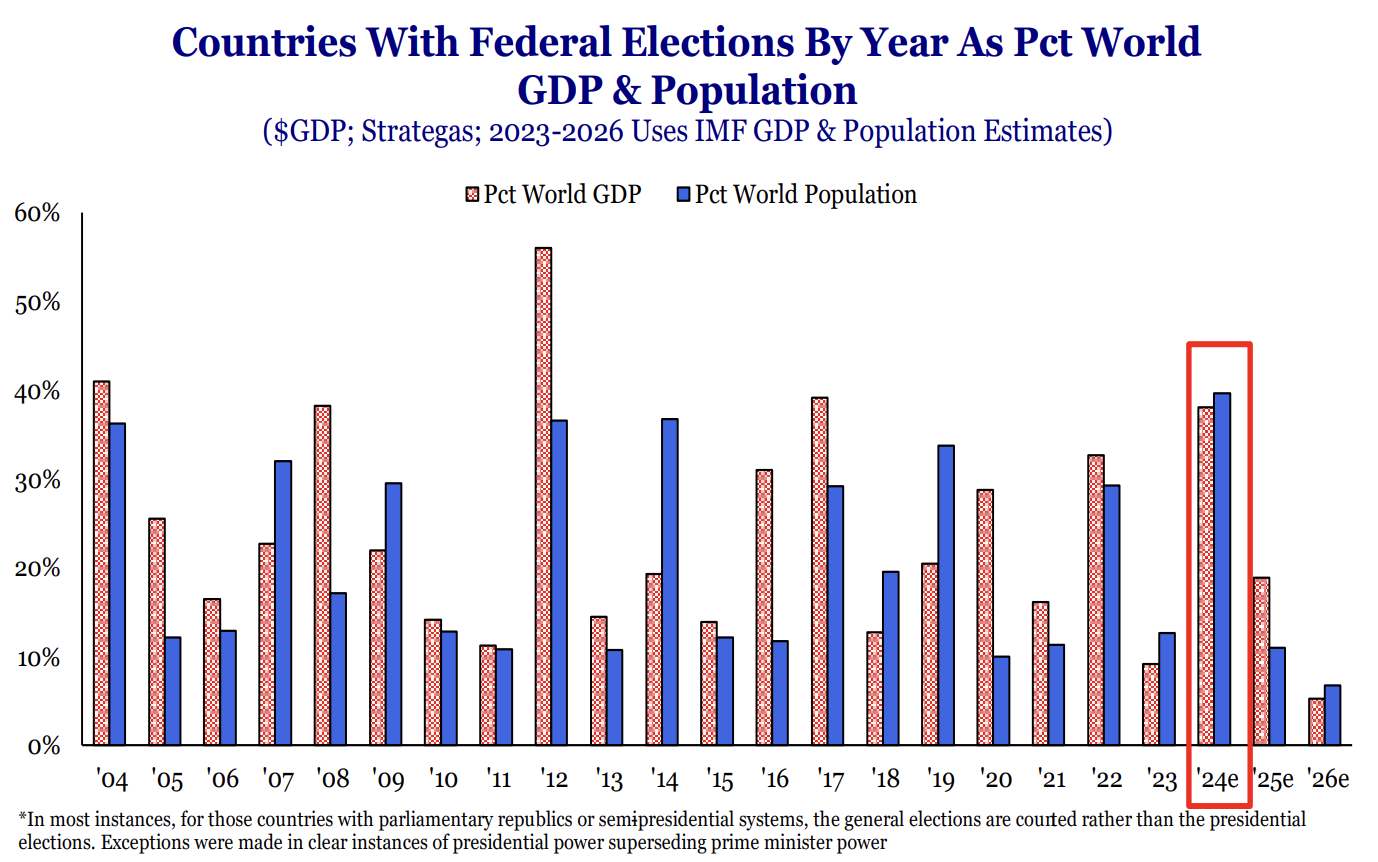 Source: Strategas as of 06.15.2024
U.S. Presidential Election and Markets
When it comes to U.S. Presidential elections, I believe that most investors automatically think that it’s going to be a volatile market environment where returns are hard to come by. Well, that couldn’t be further from the truth. First, let’s look at a few facts about the market and the election cycle that should help quell some drawdown fears, as we know remaining invested is the magic elixir to LT investing success.
Fact #1: The S&P 500 has increased in the past 13 presidential re-election years. In fact, the last time the S&P 500 fell in a presidential re-election year was 1940. And since 1940, there have been three years where the market fell during the election year – 1960, 2000, and 2008. The commonality of these three years is that there was an open election – JFK, Bush, and Obama. Furthermore, the average return of the S&P 500 during re-election years is 16%!
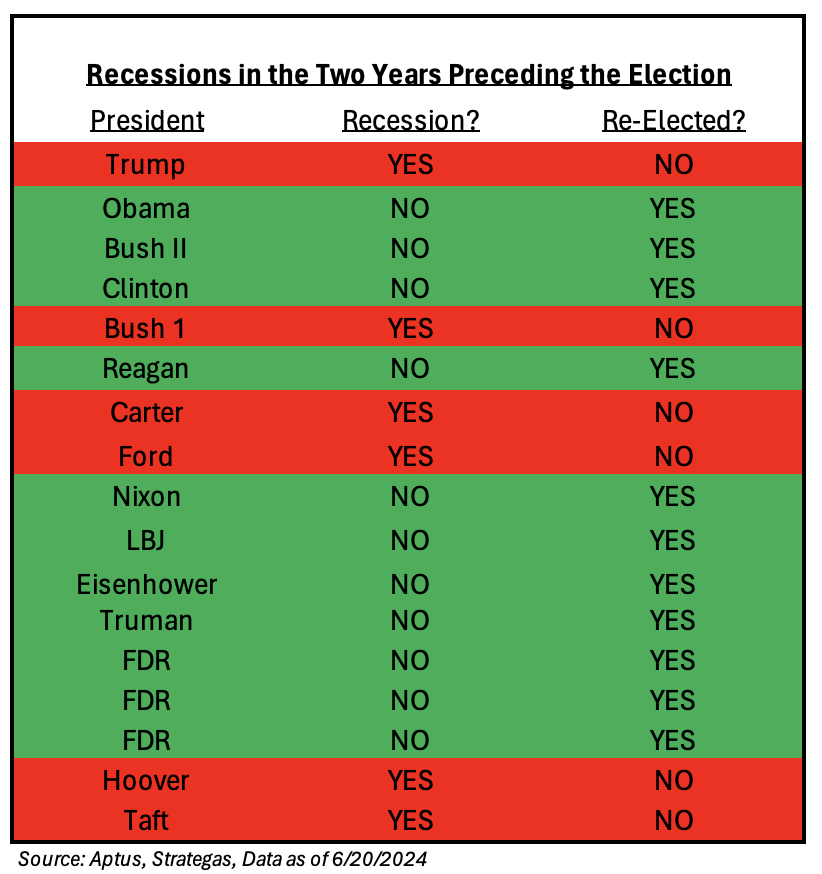
Now, why does this happen? Presidents like to “prime” the economy into an election year to minimize an election fallout. Presidents know that if there is a recession in the third or fourth year of an election cycle, the incumbent is not re-elected. Given the fiscal stimulus and liquidity injected into the economy, stocks have historically responded favorably during re-election years, and 2024 has been no different.
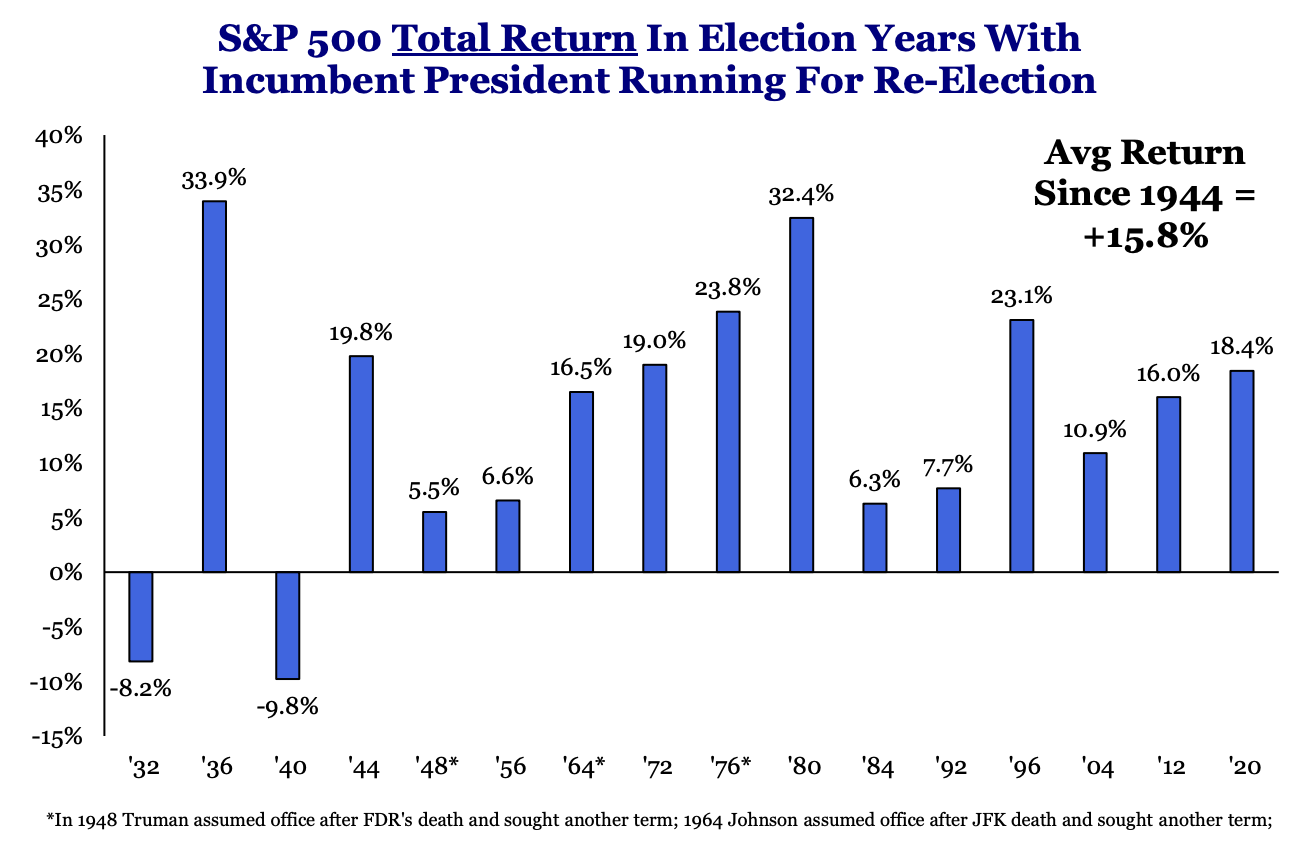 Source: Strategas as of 06.15.2024
Fact #2: Recessions have been a determining factor in whether Presidents get re-elected. If there is a recession in the two years preceding the election, the incumbent tends to not be re-elected. President Biden has already been deploying his economic tools to keep the U.S. out of a recession. Let’s take a look at a few of them:
- More borrowing on the short end of the Treasury curve to minimize liquidity drain from U.S. borrowing
- Expectations for multiple rate cuts from the Fed, QT slowing in 2024
- Oil Production At Record Highs To Keep Gasoline Prices Low
- Student Loan Cut Scheduled For July 1, 2024
- FHFA Approved Second Mortgages To Encourage Maintaining First Mortgage Interest Rates
- Potential For $60-$100bn of Employee Retention Tax Credits.
There has been a substantial amount of liquidity injected into the market over the last two years.
Fact #3: The S&P 500 in the final 90 days of the election has predicted 20 of the last 24 election winners. This is why the market has been so laser-focused on the Fed and the potential for policy easing in the second half of 2024. If stocks were higher in the 90 days before the election, the incumbent party won and vice versa. This metric did not work in 2020 but worked in the previous nine presidential election years.
Disclosures
Past performance is not indicative of future results. This material is not financial advice or an offer to sell any product. The information contained herein should not be considered a recommendation to purchase or sell any particular security. Forward looking statements cannot be guaranteed.
This commentary offers generalized research, not personalized investment advice. It is for informational purposes only and does not constitute a complete description of our investment services or performance. Nothing in this commentary should be interpreted to state or imply that past results are an indication of future investment returns. All investments involve risk and unless otherwise stated, are not guaranteed. Be sure to consult with an investment & tax professional before implementing any investment strategy. Investing involves risk. Principal loss is possible.
Advisory services are offered through Aptus Capital Advisors, LLC, a Registered Investment Adviser registered with the Securities and Exchange Commission. Registration does not imply a certain level or skill or training. More information about the advisor, its investment strategies and objectives, is included in the firm’s Form ADV Part 2, which can be obtained, at no charge, by calling (251) 517-7198. Aptus Capital Advisors, LLC is headquartered in Fairhope, Alabama. ACA-2406-21.

