I’ve had a lot of inbound calls regarding the markets over the past few weeks, so I’d like to start with some historical perspective. As our quarterly newsletter stated, future market returns will always be an unsolved mystery. But what would a recession mean for equity investors?
-
- Since 1995, when small, mid, and large-caps have declined > 20% from their 52-week highs, 40% of the time it has accurately predicted a recession. That means that 60% of the time, the market has incorrectly predicted a recession.
-
- In the 60% of the time that equities decline 20% without a recession, the average returns are 20%-30% over the next twelve months.
-
- Since 1995, when small, mid, and large-caps have declined > 20% from their 52-week highs, 40% of the time it has accurately predicted a recession. That means that 60% of the time, the market has incorrectly predicted a recession.
-
- Depending on if the market witnesses a mild recession or a full-fledged recession, returns can vary. But when a recession is avoided, equity performance is consistently positive.
-
- The average S&P 500 performance is down -24% during a peak-to-trough mild recession and 40% in severe recessions.
-
- As of today, 4/21/2025, the 52-week peak-to-trough pull back for the market is:
- S&P 500: -21.35% (from 2/19/2025)
- NASDAQ: -25.56% (from 2/19/2025)
- Russell 2000: -29.73% (from of 11/25/2024)
- Russell Mid-Cap Index: -23.57% (from 11/25/2024)
- As of today, 4/21/2025, the 52-week peak-to-trough pull back for the market is:
-
- The average S&P 500 performance is down -24% during a peak-to-trough mild recession and 40% in severe recessions.
From a valuation perspective, I think it’s safe to say that indices tend to seem to trough at mid-teens P/E on trough annual EPS.
I know that I’m writing about 2025 earnings in today’s Musing, but right now, I believe that the market has already priced in a semi-recessionary level of growth degradation in 2025, so it all comes down to 2026 earnings and where it will land. Historically, I’ve told investors that the market tends to focus on the next year’s earnings around June / July, but maybe this year the focus could begin a bit sooner than normal.
At the end of the day, the market is a forward-looking mechanism and tends to bottom long before earnings, the height of unemployment, and most importantly, investors’ emotions. And I think the below chart does a great job illustrating this.
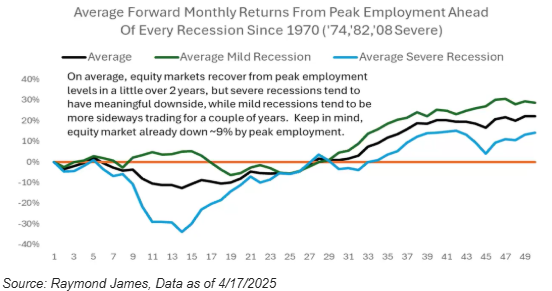
Many investors, when thinking of recessions regarding job losses, think of the magnitude and when job losses start to occur. The above chart looks at the forward monthly returns from peak employment in recessions; both mild (i.e., 1970, 1980, 1990, and 2001) and severe recessions (i.e., 1974, 1982, 2008, and 2020). Said another way, if the market witnesses a “mild” or “average” recession, if you see peak unemployment, that means the market tends to be close to a bottom.
Personally speaking, I believe many of the big-picture growth questions will center around the artificial intelligence (“AI”) narrative. If this investment theme erodes over the next 1-2 years, the recessionary narrative will likely grow. But if investor confidence in AI remains, the P/E multiple of the index may not need to normalize to the levels that it has in the past, remaining high. This could possibly lead to a “milder” recession…or “no” recession.
Only time will tell.
Q1 2025 Earnings Preview
I would say the only major update since my last musing is that the bond market has now joined in on the volatility. I tend to not look at Twitter for information, as much of it is anecdotal in nature and not helpful at best, but I do like to use it for comedic relief, as a recent tweet said: “seeing the bond guys panic is like seeing your parents cry as a kid. You don’t understand it, but you know it’s bad”. I think that sums up the equity market’s bewilderment over the past month, but again, it doesn’t mean that the world is ending.
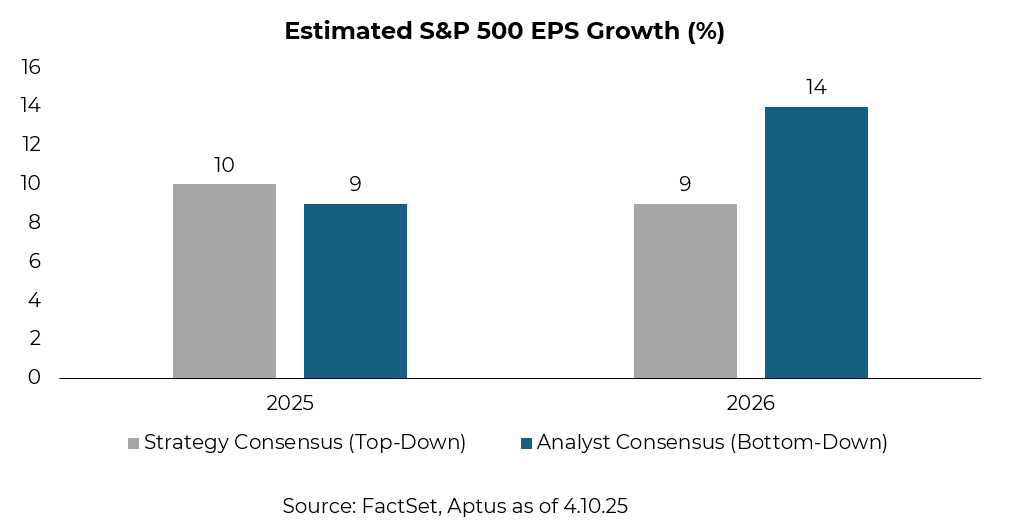
Q1 2025 earnings season officially began last week with the banks. Over the next few weeks, investors are hoping for important insight into the evolving outlook for corporate profits and activity, i.e., what will growth be in Q2 2025 and CY 2025? While markets have moved sharply in response to the shifting outlook on trade policy and economic growth, consensus earnings estimates have hardly budged. The S&P 500 has declined by ~12% year-to-date (“YTD”) and by 10% since the April 2nd tariff announcements, yet consensus S&P 500 EPS estimates for 2025 have only declined by just 2% YTD. Analysts expect 2025 S&P 500 EPS to grow by 9%, a lower bar relative to previous quarters and down from an expectation of 11% growth at the start of the year. For 2026, analysts are still calling for 14% growth – a number that hasn’t really changed this year.
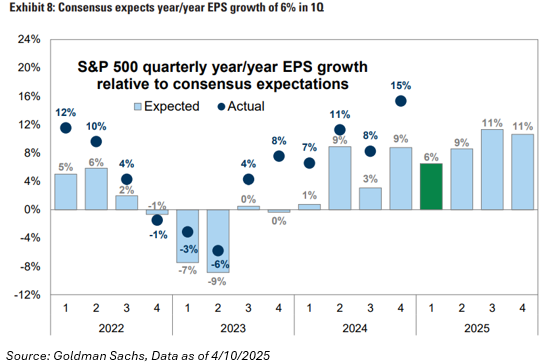
Of those revisions, most have been concentrated in Q1 2025 with revisions to consensus quarterly EPS of -4.4% in Q1, -2.4% in Q2, -1.0% in Q3, and +0.9% in Q4. These revisions have been more concentrated within the Energy and Materials sectors, while small-cap stocks appear to have exhibited the largest revisions to earnings since the start of the year, and estimates to companies in the tech-heavy Nasdaq-100 index have barely been revised.
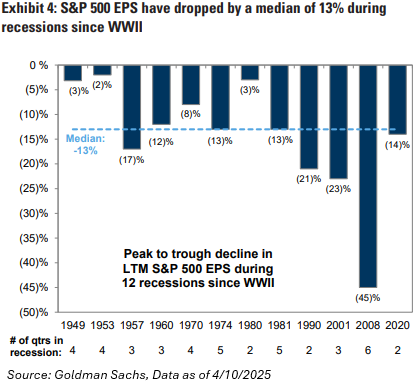
Historically speaking, during recessionary periods, on median, EPS has dropped ~13% going back to World War II. Personally, I’d prefer to look at more recent periods as a north star – since 1970, EPS has had a median drop of ~18%. I also believe that the average is closer to 25%, as the Global Financial Crisis skews this average (hence why I’m using median).
At the end of the day, the direct impact of policy changes is unlikely to be reflected in what is backward-looking Q1 data. While policy uncertainty spiked in Q1, most tariff policies are set to start in the current quarter. So, it’s all about guidance – but will we get any? During this period of uncertainty, we’d expect fewer companies than usual to provide forward guidance to both Q2 and CY 2025 – why would they? It’s only one quarter into the new year and information continues to evolve on a daily basis. Personally, I don’t see this as a reason to be pessimistic. Typically, 20% of companies provide quarter-ahead guidance on earnings calls, while 43% of companies provide calendar-year guidance. In the absence of guidance, investors should monitor sales revisions to gauge the demand outlook and capex revisions to assess the trajectory of corporate investment spending.
Lastly, we’ll see how the market digests these reports. My gut says that investors won’t be overly prescriptive around slight misses – investors know that visibility is low, and it’s a case-by-case basis. What I and the rest of our team will be doing is looking at the relative performance of winners and losers, i.e., who is executing the best amongst peer groups – e.g., Azure v. AWS or Google Search, etc. At the end of the day, we believe investors will continue to put a premium on idiosyncratic growth stories, product lines, and/or margins, so a lot of focus will be on the Magnificent Seven. Like I said in my NVDA musing from a month ago, “global growth is undoubtedly slowing. We believe that this could leave the AI trade as an idiosyncratic area of growth.” What we will learn is the CAPEX spend of these mega-caps companies this earnings season, and if it comes in better-than-anticipated, it could drive flows back to the U.S.
I understand that there are strong feelings out there about where earnings should be, but as of right now, we haven’t seen the weakening soft data transition into hard data. That doesn’t mean that it can’t. I know it’s felt like a full decade since “Liberation Day”, but it’s only been three weeks of substantial policy uncertainty, and in the grand scheme of things, it’s only been three weeks. For those counting at home, there are 52 weeks in a calendar year. So, duration of uncertainty matters. The longer it lasts, the more it can weigh on growth.
Stay nimble.
Disclosures
Past performance is not indicative of future results. This material is not financial or tax advice or an offer to sell any product. The information contained herein should not be considered a recommendation to purchase or sell any particular security. Forward looking statements cannot be guaranteed and all calculations may change due to changes in facts and circumstances.
This commentary offers generalized research, not personalized investment advice. It is for informational purposes only and does not constitute a complete description of our investment services or performance. Nothing in this commentary should be interpreted to state or imply that past results are an indication of future investment returns. All investments involve risk and unless otherwise stated, are not guaranteed. Be sure to consult with an investment & tax professional before implementing any investment strategy. Investing involves risk. Principal loss is possible.
Advisory services are offered through Aptus Capital Advisors, LLC, a Registered Investment Adviser registered with the Securities and Exchange Commission. Registration does not imply a certain level or skill or training. More information about the advisor, its investment strategies and objectives, is included in the firm’s Form ADV Part 2, which can be obtained, at no charge, by calling (251) 517-7198. Aptus Capital Advisors, LLC is headquartered in Fairhope, Alabama. ACA-2504-25.
