Happy Thanksgiving! At the Wagner household, Arlo Guthrie’s 1967 20′ masterpiece, Alice’s Restaurant, is viewed as a Thanksgiving fan favorite, likely because I’m the only one living in the household. Enjoy.
Much like in my beloved Bengals’ recent loss to the New England Patriots, the market hasn’t needed, nor had a defense. But the recent slip in price performance, although the market at one point was only off its all-time highs by 5.07%, has sparked the alarm bells in the eyes of a lot of investors. So, let’s quickly talk markets, though it won’t be in a four-part harmony with circles and arrows on the back of each chart (H/T Alice’s Restaurant lyrics).
It’s no surprise that I’ve fielded a large swath of questions on the market pullback. The consensus is that there’s been: (1) some slippage in AI enthusiasm (pesky Michael Burry entered the chat but was “burried” this past weekend by Jensen; reach out if you’d like to see the memo), plus, (2) some erosion of certainty of further Fed rate cuts in ’25.
Front-running the former outcome, based on some marginal deterioration, is often premature. While those bearish concerns could turn out to be real in the future, the reality is that the facts haven’t deteriorated enough to warrant the outlook shifting materially more negative.
I’d actually frame the market pullback question differently – is this just (1) a rotation in flows, or (2) something more sinister lurking under the hood? I think that the Fed rate cuts and slippage in AI enthusiasm are just easy scapegoats. Personally, I think the pullback has been due to transitioning flows and lighter-than-expected liquidity in the market. Because it sure ain’t from a fundamental perspective, as you’ll see in the earnings review section below.
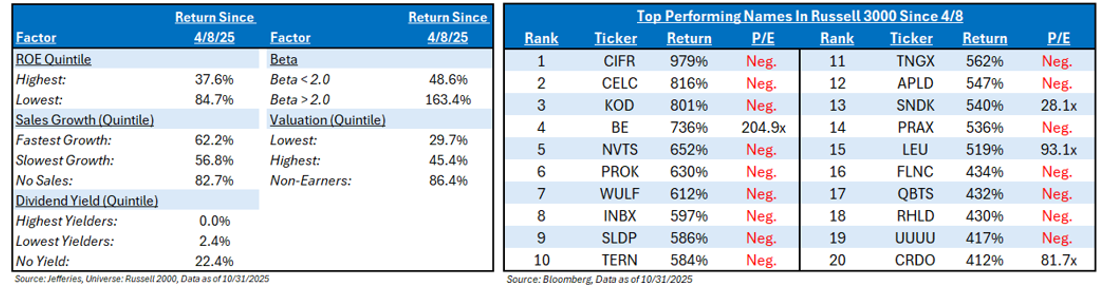
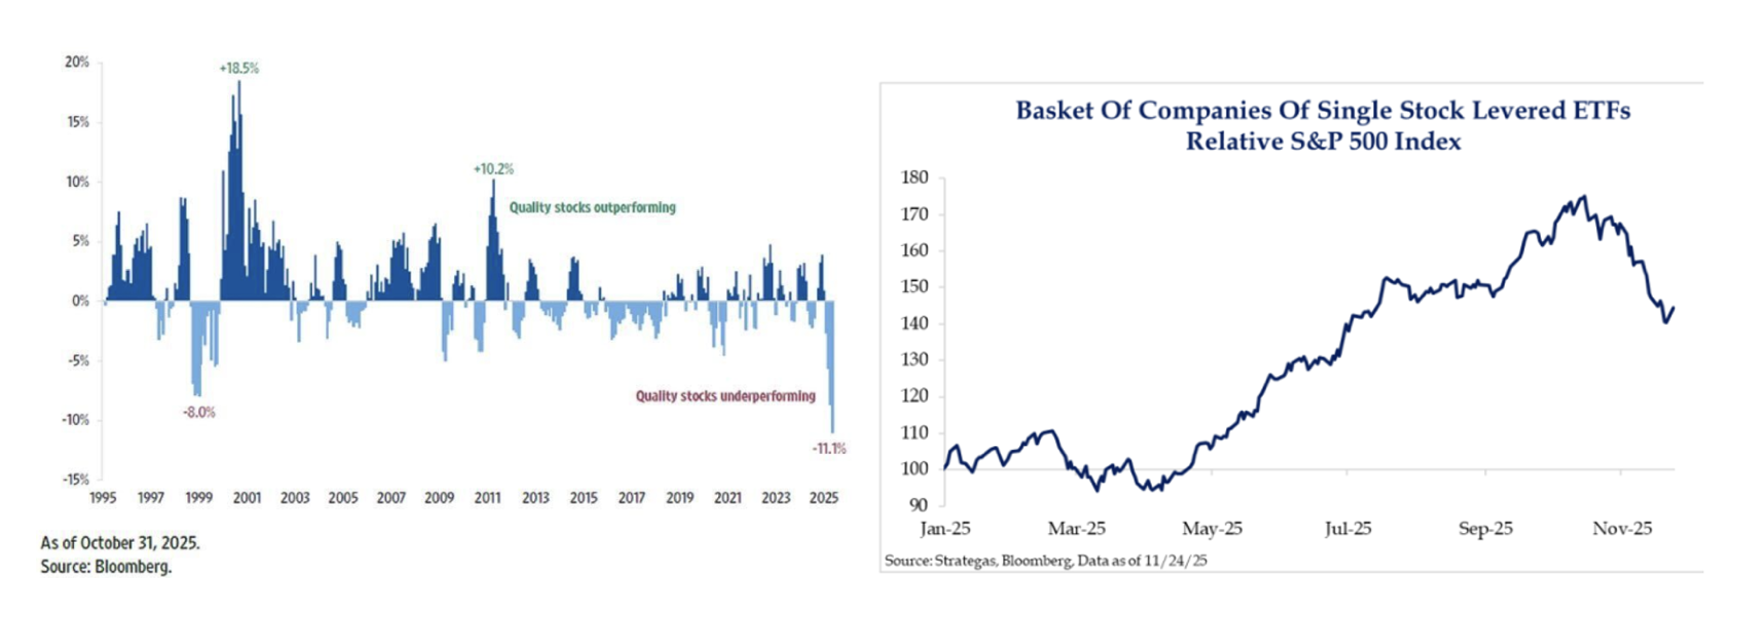
1. Rotation in Flows: Given AI skepticism, investors have been quick to flip the light switch from risk-on areas of the market to more defensive areas. Everybody here has heard us speak about the lower-quality rally that stocks have had since the recent April 8th bottom (see the chart on the left and middle). We’ve seen the High Beta factor become a bit more volatile over the past few weeks – this technical tendency tends to mean that the factor’s performance may be getting a little long in the tooth.
As I explained on a recent Schwab TV appearance, when higher beta tops out, it rarely means that the market tops – in fact, it’s quite the opposite. A lot of the movement underneath the hood during the pullback witnessed capital being pulled out of the more speculative areas of the market and into more defensive areas (chart on the right-hand side). Let’s hope the transition into rationality picks up steam.
2. Softer Market Liquidity: The decision by the Fed not to end QT until December was somewhat head-scratching (per JL), not a fatal one at all, but it just makes the plumbing issues more difficult, which likely had a liquidity effect on the market. The Fed will begin Reserve Management Purchases (RMPs) of bonds in December to ensure that bank reserves do not fall relative to GDP. Then, one of my favorite charts heading into next year is a different style of liquidity that comes from fiscal policy.

But, hey, that boring rationale doesn’t drive clicks.
Q3 2025 S&P 500 Earnings Review
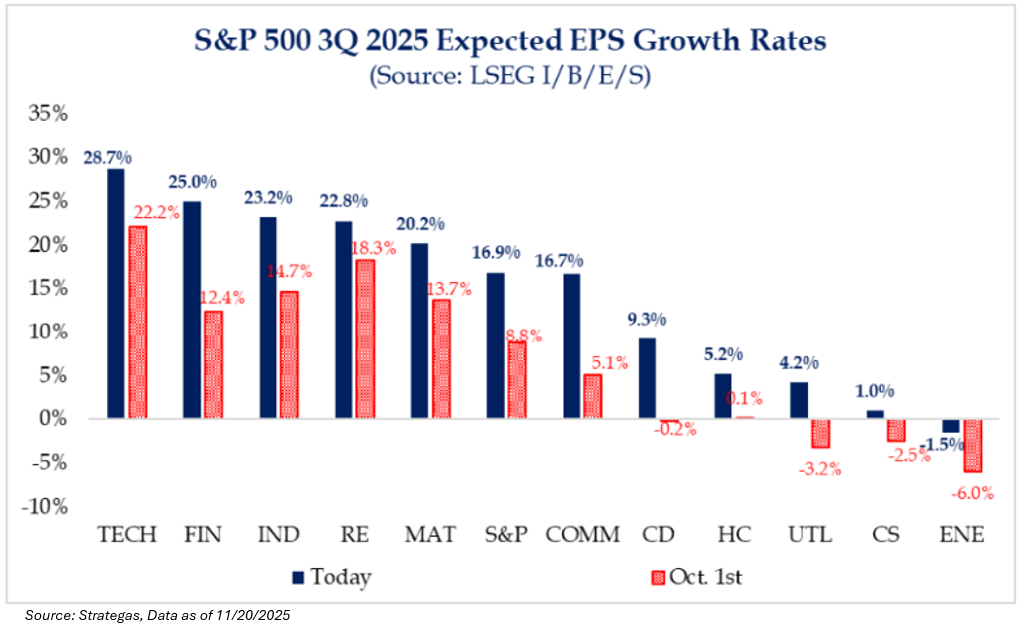
Earnings for Q3 ’25 have been strong across the board, coming in at over 15%. Every sector exceeded its initial estimates, and 11 of the 11 sectors also surpassed expectations on the bottom line (Net income or EPS). With so much discussion around a potential market slowdown or even a recession, it’s hard to reconcile those concerns with an economy that’s moving from roughly double-digit growth to no growth at all.

Putting this in perspective, the market continues to underestimate the amount of operating leverage embedded in the S&P 500. The table below shows this, as the market was only expecting earnings growth in Q3 of 8.8% (as of 10/1/2025); the actual growth rate was 16.9%.
Here’s my favorite stat that I heard during earnings season: I read that the “One Big Beautiful Bill” (OBBB) could add $7-$8 to 2025 S&P 500 EPS, boosted by corporations. But, in 2026, this figure could rise to an immediate $20 boost from tax benefits on the consumer; basically, a +6.5% EPS boost of direct accretion.
AI Capex Thoughts
The Q3 earnings season has catalyzed another move higher in AI capex estimates alongside renewed investor concerns surrounding the risks associated with the AI investment boom. Consensus 2026 capex estimates for the AI hyperscalers (AMZN, GOOGL, META, MSFT, and ORCL) have risen from $467B (+20% YoY growth) at the start of the earnings season to $533B today (+34%YoY). The “AI trade” has remained concentrated within the infrastructure complex, but return dispersion across that complex has increased. Much of the dispersion has been driven by the degree of investor confidence that AI investments are generating revenue benefits. The magnitude of leverage used to fund those investments has also contributed to the return dispersion.
Cash flows and balance sheet capacity are unlikely to constrain large public AI hyperscaler capex spending in 2026. While the vast majority of hyperscaler capex has so far been funded out of cash flows, many of these companies have the capacity for substantial debt funding as well. Since 2021, the hyperscalers have collectively increased the net debt on their balance sheets by $295 billion, but their collective net debt/EBITDA leverage remains just +0.2x. We’ve read that these companies could add $700B in net debt to their balance sheets without lifting their net leverage above 1x. Supply bottlenecks or investor appetite are more likely to act as constraints on near-term capex than cash flows or balance sheet capacity.

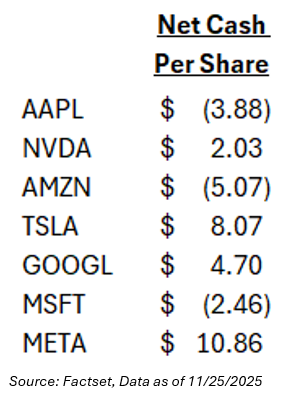
Not only that, but a lot of people don’t know that 4 of the 7 Magnificent 7 companies have positive net cash per share. They can weather some increase in debt, as their balance sheets are unencumbered.
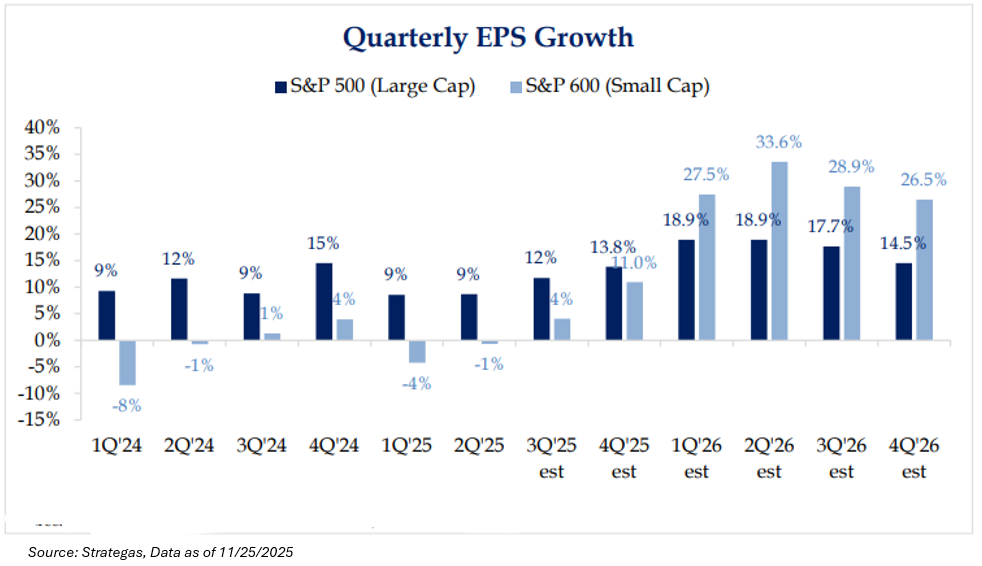
Growth in the Smaller Market Cap Cohort
Small-cap EPS growth is projected to inflect meaningfully higher in 2026. Persistent earnings underperformance has been a structural headwind to the fundamental case for the asset class, but that dynamic appears poised to reverse – supported in part by favorable base effects in the first half of the year. The current soft patch in fourth-quarter activity, coupled with uncertainty around the timing and scope of the monetary easing cycle, has intensified near-term growth concerns.
These factors tend to be disproportionately negative for small caps given their elevated sensitivity to cyclical trends. However, should markets navigate this interim period until the onset of OBBBA-related stimulus in early 2026, we believe the combination of accelerating earnings momentum and a continued valuation discount could present a compelling relative opportunity for small-cap exposure.
As always, if anyone would like individual earnings commentary on certain concentrated client positions, give me a call.
Disclosures
Past performance is not indicative of future results. This material is not financial advice or an offer to sell any product. The information contained herein should not be considered a recommendation to purchase or sell any particular security. Forward-looking statements cannot be guaranteed.
Projections or other forward-looking statements regarding future financial performance of markets are only predictions and actual events or results may differ materially.
This commentary offers generalized research, not personalized investment advice. It is for informational purposes only and does not constitute a complete description of our investment services or performance. Nothing in this commentary should be interpreted to state or imply that past results are an indication of future investment returns. All investments involve risk and unless otherwise stated, are not guaranteed. Be sure to consult with an investment & tax professional before implementing any investment strategy. Investing involves risk. Principal loss is possible.
Advisory services are offered through Aptus Capital Advisors, LLC, a Registered Investment Adviser registered with the Securities and Exchange Commission. Registration does not imply a certain level of skill or training. More information about the advisor, its investment strategies and objectives, is included in the firm’s Form ADV Part 2, which can be obtained, at no charge, by calling (251) 517-7198. Aptus Capital Advisors, LLC is headquartered in Fairhope, Alabama. ACA-2511-20.
