There Have Been More Ladders than Chutes this Year
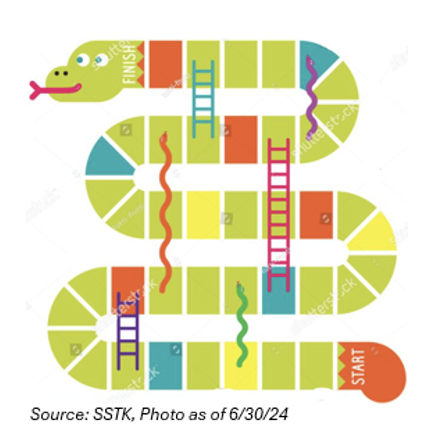 The children’s game, Chutes and Ladders, originated in ancient India by Buddhists to teach children that the path to righteousness was difficult and riddled with temptation. In its original form, called Mokshapat, there were more chutes than ladders – indicating that leading a virtuous life was much more difficult than leading an evil one.
The stock market, in many ways, is no different. Like Chutes and Ladders, the market is simplistic yet riddled with temptation, with a pathway that is neither straight nor easy. To navigate the market, it’s important to improve the odds of climbing a ladder while minimizing the chances of falling victim to a chute. At the allocation level, we own more stocks, less bonds, while remaining risk neutral. By being over-allocated to growth assets, like stocks, we believe that we provide investors with more opportunities to climb ladders, while owning volatility as an asset class to cushion the impact from the occasional chutes.
In Q2, despite some chutes, there were plenty of ladders. The S&P 500 increased 4.28%, bringing the year-to-date return to 15.29%. This rally marks the 12th best first half start to the market since 1950. Historically, since 1900, when the S&P total return was up at least 15% in the first half of the year, the median return for the second half was 8.9% with a 72% hit rate of being positive. This exceeds the 7.3% median return for all years.
In a market uptrend, it pays more to be patient than clever. It’s easy to follow the temptation of trying to call a market top on the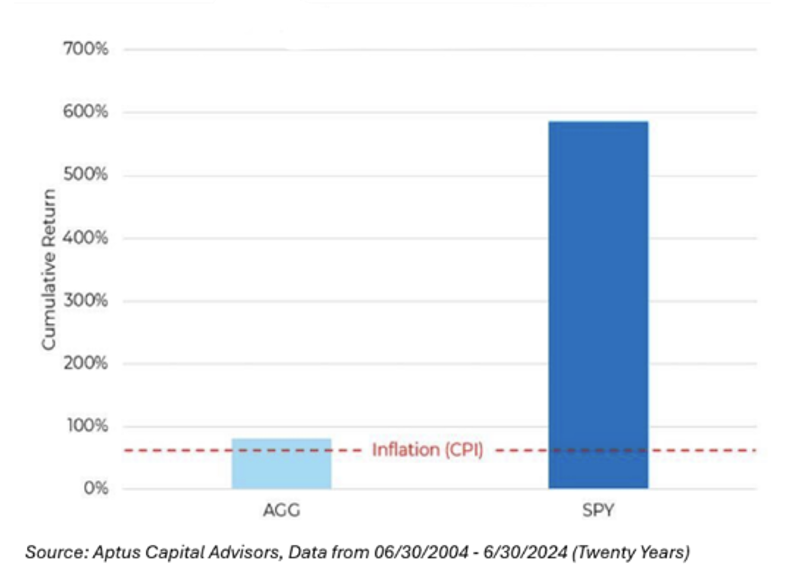 S&P 500 or the market’s favorite darling, NVIDIA Corp (NVDA). Many investors have even stated that they want to T-Bill and Chill, collecting a 4.5% interest rate, as they feel the market is toppy. Yet, if the investor decided to be overly cautious and T-Bill and Chill, they could be falling into the biggest chute of all – missing out on returns due to opportunity cost and not having a compounded annual growth rate (“CAGR”) that’s supportive of their long-term goals.
Simply put, it’s not adverse market conditions that derail compounding but investors’ reactions to them. Over the last twenty years, an investor who derisked into bonds has barely outperformed the government’s, likely understated, measure of inflation, and this is before taxes. This action unintentionally injects longevity risk into a portfolio, creating an environment where an investor must work longer, or spend less, given a lower-than-expected CAGR.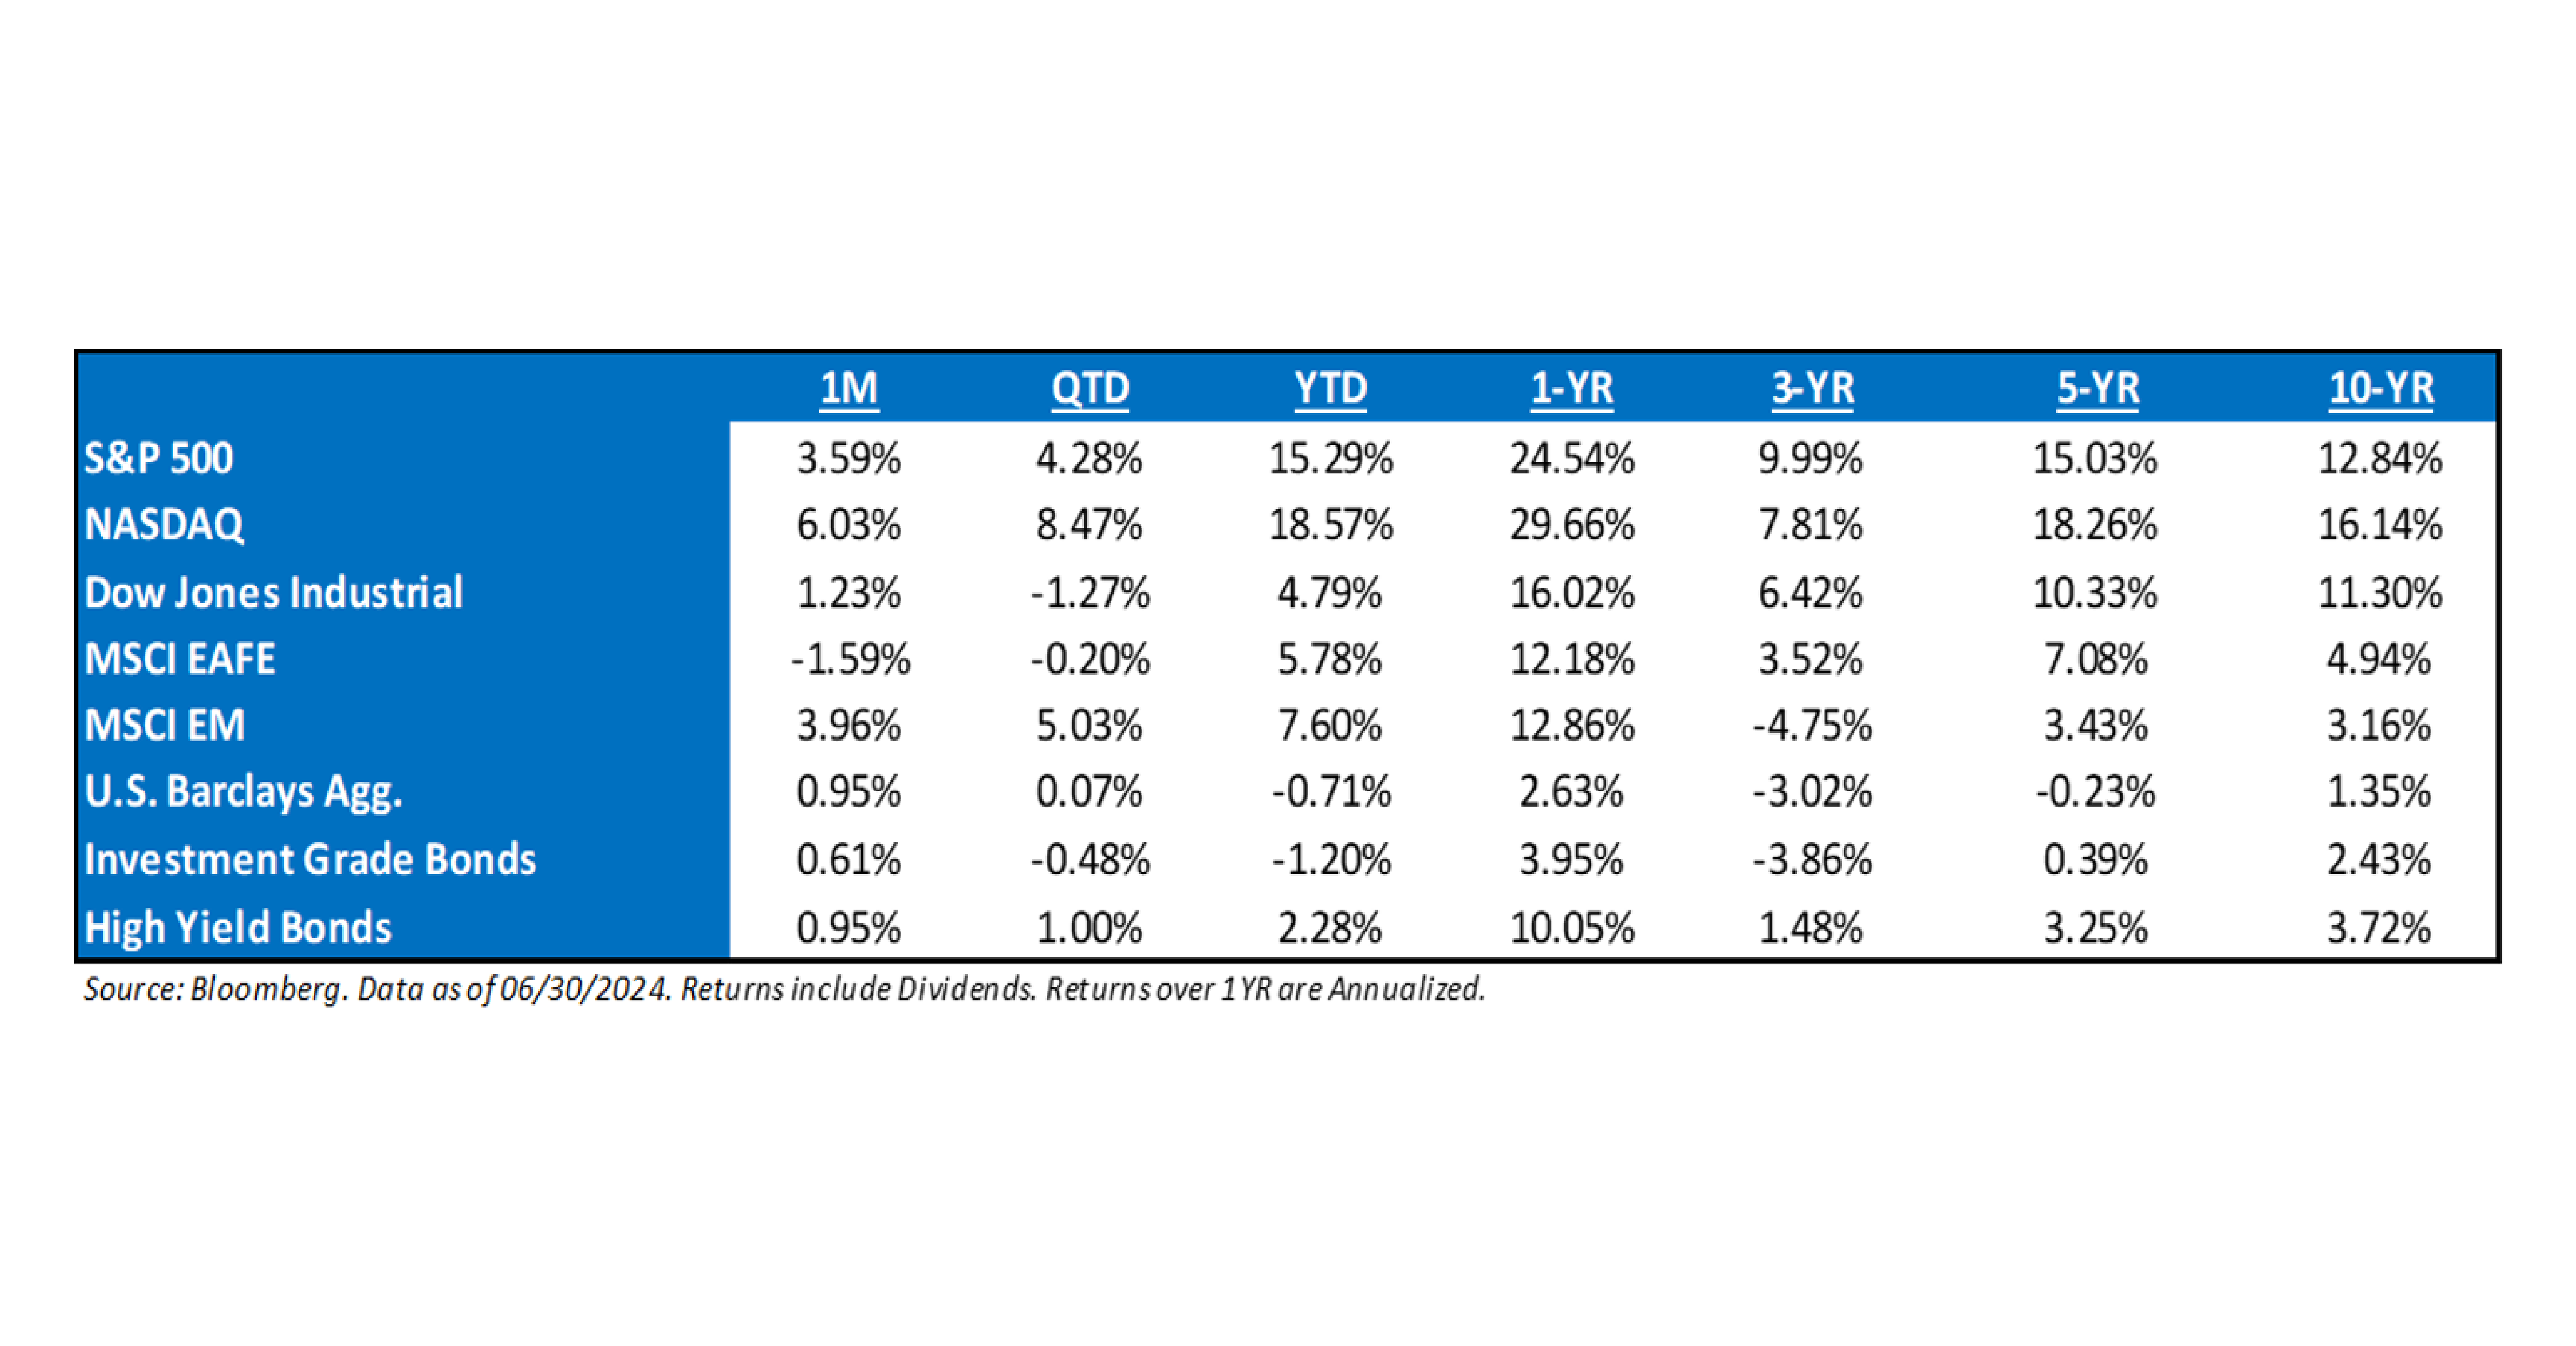 Chutes Derail CAGRs
Investors understand the bad math of drawdowns – that’s why they tend to focus on protecting capital during volatile environments. For example, a 50% drawdown requires a 100% rise to get back to even.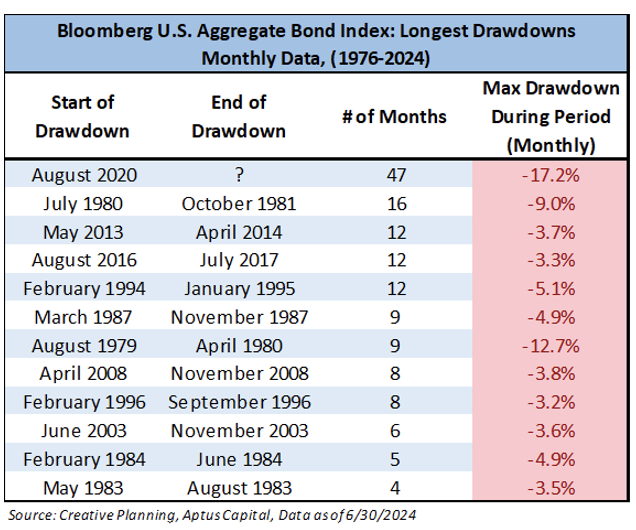
When investors think about drawdowns, they are often viewed from the lens of the equity market, not the bond market, as equity drawdowns occur more often and bonds are generally considered a “safe” asset as they are less volatile than the stock market.
Yet, bonds are currently experiencing their largest drawdown since their 1976 inception – both in terms of both magnitude and length of time. And the numbers get even worse if you go further down the yield curve from a duration perspective.
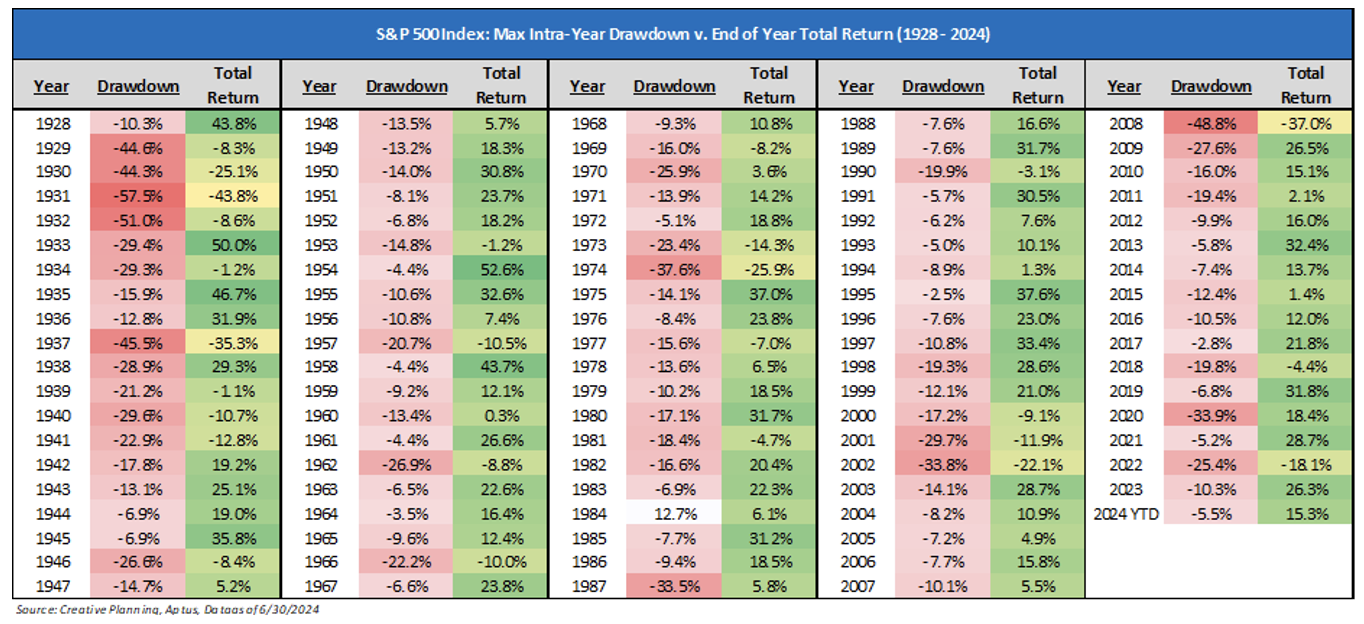
Equity chutes happen more often, with the market typically witnessing three (3) 5%+ pullbacks and one (1) 10%+ drawdown, on average annually. Pullbacks are healthy and should not cause concern. The below chart helps paint a great picture of the max drawdown each year, while also showing the performance at the end of the year. It pays to remain invested.
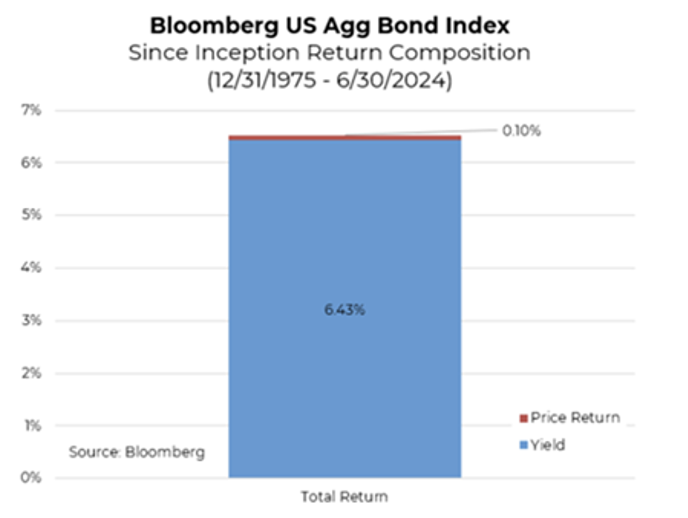
The difference between equity chutes and fixed income chutes is that equities have more levers to pull for growth, such as increasing revenues or margins, while fixed income relies primarily on interest rates.
And if history tells you anything, it’s that yield, not price, drives fixed income returns over a longer period of time – so making a bet on duration to drive bonds out of their longest drawdown period, seems like a loser’s game.
One of the biggest risks facing investors today is the over-reliance on fixed income to buffer against volatility – when, in fact, we believe that owning bonds only buffers your opportunity to have CAGRs that are supportive of your individual long-term financial plans. Investors should give themselves the opportunity to take more ladders and minimize the effects of chutes to compound their probability of success.
Ladders Drive CAGRs
Focusing on ladders, the market has seen 32 different closing all-time highs (“ATH”) this year – nearly 25% of the trading days. This fact alone is worth a few superlatives:
- Since 1900, there have been 25 years when the S&P 500 total return index was up more than 15% in the first half (excluding 2024). The first half of 2024 was the 21st best since 1900.
- The last time the second half of the year was down after being up 15% in the first half was 1986. It is uncommon for the second half to be negative after a strong start to the year, with this occurring only seven times since 1900.
- In Presidential years since 1900, 2024 is the third-best start, behind only 1908 (William Howard Taft) and 1976 (Jimmy Carter). In those years, the second half also remained strong, with 1908 rallying 20.9% and 1976 rallying 5%.
- Since 1900, if the S&P total return is up at least 15% in the first half, the median return for the second half is 8.9%, with a 72% chance of being positive. This exceeds the 7.3% median return for all years.
Despite some signs of softening momentum, the global economy remains strong, and market performance is robust. Corporate profit expectations are broadening, and focusing on growth remains crucial. Inflation around 3% isn’t inherently threatening, but the Fed’s approach to handling slowing growth could be pivotal. The “higher for longer” environment could increase the likelihood of an economic slowdown, posing a risk to the current rally. Growth remains the focus and the driver of this rally, or… the rally killer.
Conclusion
This year has been a great reminder that it pays to be a rational optimist when it comes to the markets. Pessimism about the long-term does not align in any way with a historical worldview. Investors can choose to believe that right now is the beginning of the end, but that is a bet against all of human history and against human nature itself. As has always been the case, progress occurs against an inevitable backdrop of catastrophe. Always has, always will. Invariably, you can always find what you go looking for and your investment results will probably mimic that worldview.
That’s why it pays more to be patient than clever.

The performance data represents past performance & does not guarantee future results. Investment return & principal value of an investment will fluctuate, so an investor’s shares may be worth more or less than original cost when sold. Current performance may be higher or lower than quoted performance. Returns are expressed in US dollars, & periods >1 year are annualized. Returns are calculated net of all fund fees and expenses. Net returns shown include the deduction of the highest sub-advisory fee charged to our clients in sub-advisory arrangements, 0.15%. This is the maximum subadvisory fee paid during the time periods presented, and individual accounts may pay a lower effective fee. For our fee schedule please refer to Form ADV 2A, which is available upon request . Actual client results may be lower based on imposition of additional advisory fees, platform fees, & custodial fees charged by firms. iShares Core Allocation ETFs are designed as diversified core portfolios based on the specific risk consideration of the investor. For performance through most recent month end, please call (251) 517-7198 or visit impact-series.com/fact-sheets
Disclosures
Past performance is not indicative of future results. This material is not financial advice or an offer to sell any product. The information contained herein should not be considered a recommendation to purchase or sell any particular security. Forward looking statements cannot be guaranteed.
This commentary offers generalized research, not personalized investment advice. It is for informational purposes only and does not constitute a complete description of our investment services or performance. Nothing in this commentary should be interpreted to state or imply that past results are an indication of future investment returns. All investments involve risk and unless otherwise stated, are not guaranteed. Be sure to consult with an investment & tax professional before implementing any investment strategy. Investing involves risk. Principal loss is possible.
Advisory services are offered through Aptus Capital Advisors, LLC, a Registered Investment Adviser registered with the Securities and Exchange Commission. Registration does not imply a certain level or skill or training. More information about the advisor, its investment strategies and objectives, is included in the firm’s Form ADV Part 2, which can be obtained, at no charge, by calling (251) 517-7198. Aptus Capital Advisors, LLC is headquartered in Fairhope, Alabama. ACA-2407-3.


