When we think about narratives surrounding slowing economic growth, our job as investors is to translate narrative into number. In other words, if the Federal Reserve continues to hike interest rates, if the housing market gets sluggish, if unemployment starts to rise, if consumers increasingly spend less – what do these equate to in terms of equity prices? Moreover, one can’t explore a news outlet without hearing grim projections. As an example, JPMorgan CEO, Jamie Dimon says “chances of a soft economic landing are slim”, and warned Congress that “if there’s an imminent recession, it may not be a mild one.” (USA Today, 9/22).
First, we’ll walk through the above sample of negative themes plaguing equity market commentary at present. Then, we’ll discuss how the market prices a stock and in what ways these themes affect that pricing. Finally, we’ll think about what translating these narratives could mean for price levels on the S&P 500.
Fed Funds on the Rise
The Federal Reserve met on Sept 21 and voted to increase the Federal Funds rate by 0.75% to a range of 3.00%-3.25%. Notes from the release implicated an additional raise of 1.25% through the end of 2022, with the potential to go flat / higher in 2023. For context, the Fed kept the funds rate at 0.00%-0.25% for over a decade through earlier this year, besides a brief upward and quickly reversed stint from 2016-2019.
We think what’s troubling is how wrong the Fed has been in seeing this coming. First, they labeled inflation as “transitory,” opting to hold rates flat at 0% for what, in hindsight, was entirely too long. Even since that point, they have continually been behind the curve, as demonstrated by their own projections:
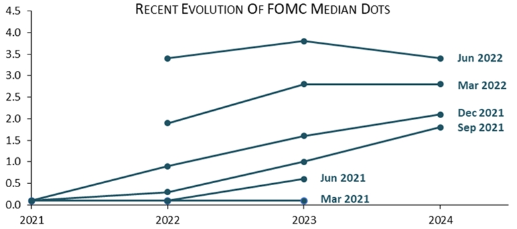 Source: Piper Sandler, 9.19.22; highlights Fed rate forecast at each meeting (date listed right); excludes 9.21.22 meeting, which witnessed another shift higher
Why does the Fed continue to increase interest rates? Because they are trying to quell inflation, the likes of which we haven’t seen in forty years. The means by which they hope to accomplish that is by stifling economy growth via tighter financial conditions.
The stickier inflation proves to be, the more they are demonstrating their will to end it via rate hikes. As we will see later, rising interest rates have a mostly negative impact on equity prices, serving as a headwind in this current environment.
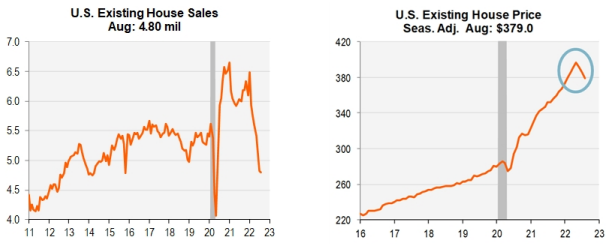
Housing Market Under Significant Pressure
The Sept 21 reading on single-family existing home sales sank to just 4.28 million, the weakest since Nov 2015 – they are now down 28% from the pandemic peak. The primary culprit is affordability fueled by rising mortgage rates, which recently touched levels not seen since 2008.
 Source: Piper Sandler, 9.21.22
 Source: Bloomberg, LP; highlighting Bankrate.com US home mortgage 30 year fixed national average at 6.43%, highest since 2008; data as of 9.22.22
Resiliently Low Unemployment Rates, But…
The current employment picture can be described as none other than robust. Not only is unemployment low, but job openings remain high. According to Strategas, there remain roughly 11 million job openings against 6 million unemployed. Part of that mismatch is due to a decades-low labor participation rate, fueled by an aging demographic and lifestyle trends which were altered during the COVID lockdowns.
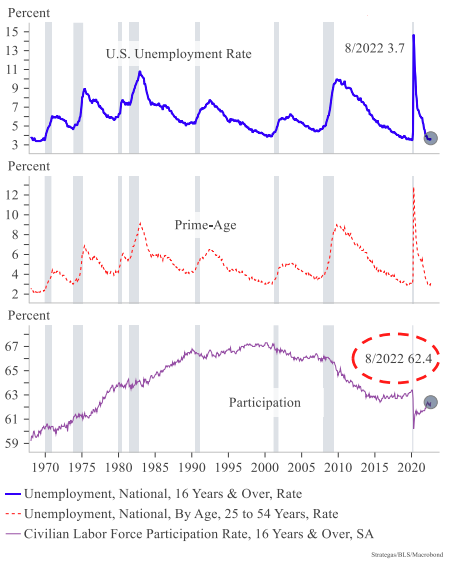 Source: Strategas, 9.2.22
With that said, there have been signs of change, especially in those areas which witnessed outsized growth during the pandemic. Here is just a sample of those making cuts:
- Snap: 20% of employees
- Robinhood: >1,000 employees
- Coinbase: ~18% of employees
- Peloton: >4,150 employees
- Shopify: ~1,000 employees
- Rivian: ~6% of employees
- Re/Max: 17% of employees
The Fed released its latest unemployment forecast on Sept 21, calling for 4.4% by 2024, 0.7% higher than current levels. Piper Sandler notes, “There has never been a situation where the unemployment rate rose more than about 0.5% without the economy entering recession.
So the FOMC (Federal Open Market Committee) forecast is an implicit admission that a recession is likely, unless something extraordinary happens.” Their goal is to squash job openings before jobs, and in so doing, take slack out of the labor market. But in their own estimation, they predict casualties to actual jobs as they tighten financial conditions.
The State of the Consumer
Coming into 2022, there were multiple reasons to be positive on the state of the consumer: healthy household balance sheets, robust savings accounts buoyed by pandemic stimulus, all-time highs in equity and housing markets, and low unemployment. Most of those positives have slowly (or in some cases, quickly) waned. After a violent jump in real (inflation-adjusted) consumer spending, we’re witnessing a move back toward trend.
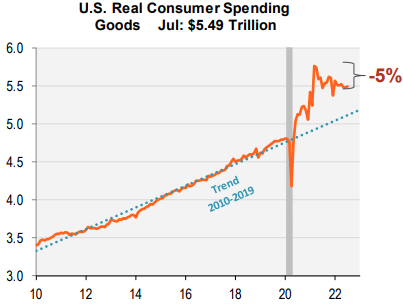 Source: Piper Sandler, 9.13.22
Inflation has clearly taken its toll, as an increasing number of consumers cite rising prices as their greatest concern, leading to austerity in their purchases. Naturally, the next step is all-out inability to pay, which is on the rise.
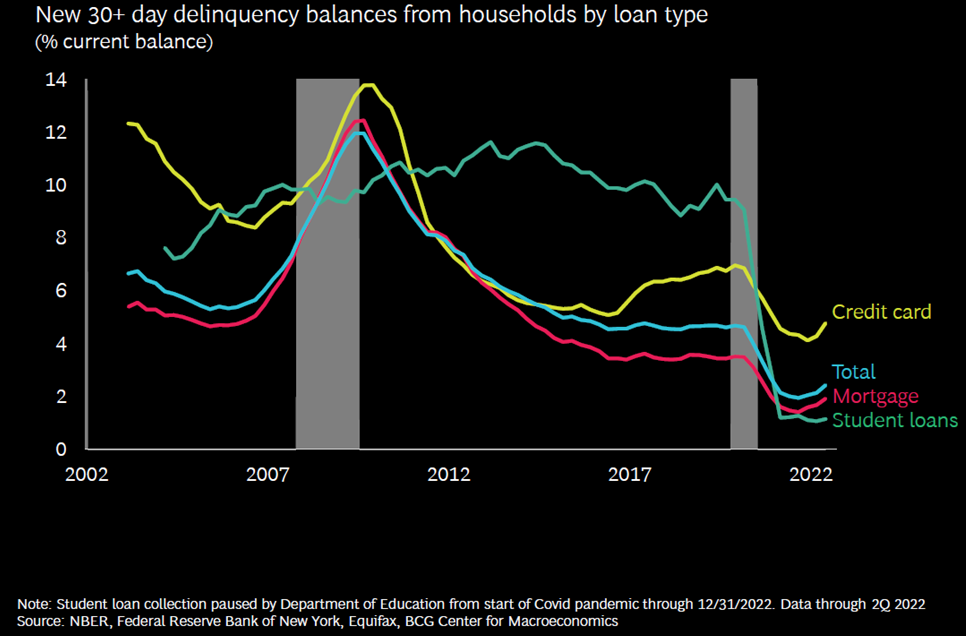 Source: Boston Consulting Group, 9.14.22
Turning now to equity pricing, markets ultimately rely on the price-to-earnings ratio, otherwise known as the equity multiple. Simply put, the equity multiple equals the price of the stock (or index) divided by the next-twelve-months (NTM) estimate of that stock’s earnings per share (EPS). Basic algebraic manipulation then reveals that the price of a stock (or index) is equal its NTM EPS x the equity multiple.
EPS is an easy concept to understand, it represents the total net accrual earnings of a company divided by the number of outstanding shares. The equity multiple is a bit more complicated, and indeed, not a fixture. It is a measure of value expressed by market participants; it reflects the future prospects for the company, the relative current risk environment, and the overall cost of capital (i.e., interest rates).
A company with bright future prospects for growth, such as Apple or Google, typically earns a higher equity multiple than a cyclical commodity producer like Exxon or Alcoa. That aspect concerns individual companies; factors such as risk premium and interest rates affect the equity multiple more holistically. If the perceived level of risk is high, investors will demand a lower multiple in an effort to protect against that risk.
Likewise, as interest rates rise (in particular, real interest rates, which take inflation into consideration), equity multiples tend to contract, as the discounting of future earnings becomes more expensive. Changes in expected EPS and changes in the equity multiple are the quantitative expressions of the economic themes expounded upon earlier.
There are many ways by which we can assess the risk environment. One is consumer sentiment, as measured by the University of Michigan – a multi-part survey taking consumer temperature on personal finances to economic conditions. As extreme as it may seem, that measure is currently in the territory tested during the Great Financial Crisis.
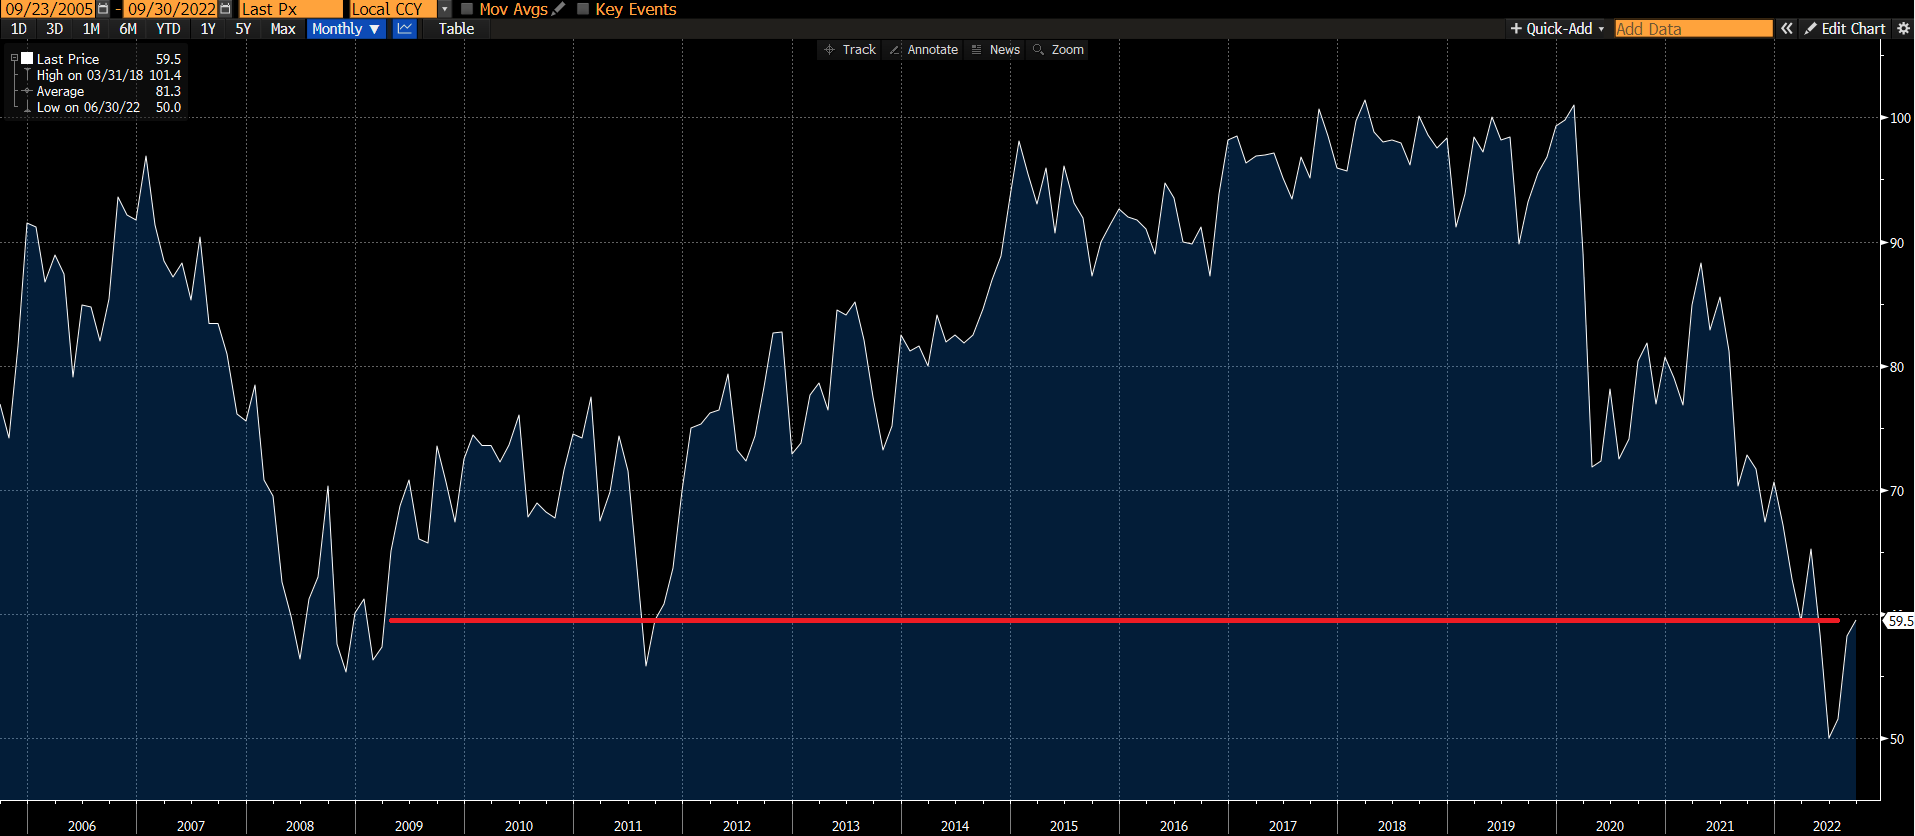 Source: Bloomberg, LP; highlighting University of Michigan Consumer Sentiment Index reading in range of 2008 (Great Financial Crisis) and 2011 (S&P downgrade of US debt); data as of 9.16.22
Moving to interest rates, we’ll provide a simple illustration. Ultimately, a company is worth its estimated future cash flows, discounted to the present day. When interest rates are low, future cash flows are worth more, as the opportunity cost of waiting is less severe.
When interest rates rise, investors have the choice between waiting or receiving a higher return on investment today. As a result, the discount rate used to value future cash flows increases, lowering their value today. Therefore, it stands to reason that rising interest rates – in particular, rising real (inflation-adjusted) interest rates – have a negative correlation to the equity multiple.
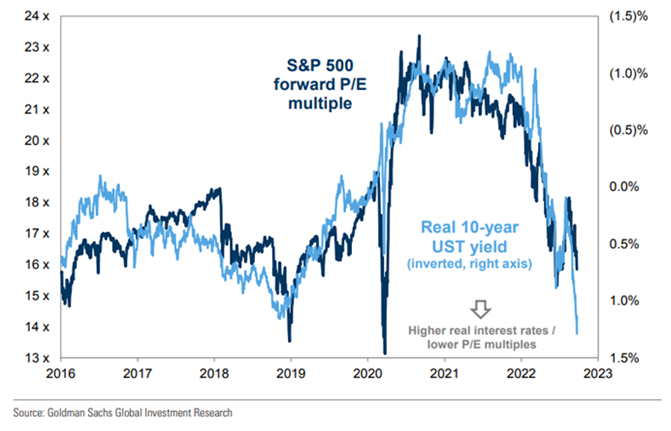 Source: Goldman Sachs, 9.23.22
Current analyst estimates for 2023 S&P 500 EPS are $244. This is down roughly 3.5% from the peak estimate earlier this summer, but a sizable jump from the $193 earned in 2021. We’re beginning to see some capitulation in that number, with some macro research shops calling for $190-$200. Based on S&P 500 9/23 closing price, P/E on 2023 earnings of $244 is 15.2x. That is quite a re-rate from the beginning of the year, when the NTM P/E was 21.0x.
One could infer from the chart above that the equity multiple has further to fall, but let’s assume real interest rates eventually reverse course and drop from here…a likely scenario, says Jefferies Trading Desk, if 2023 EPS were to be revised to the $190-$230 level. In that case, 15x equity multiple x $200 2023 EPS = S&P 500 3,000, 19% lower than 9/23 levels. Stated in terms of the 10yr real rate, this is what a pricing matrix could look like (note: with the current 10yr real rate at 1.3%, we would equate the 1.25% scenario below as roughly equivalent to a 15x equity multiple):
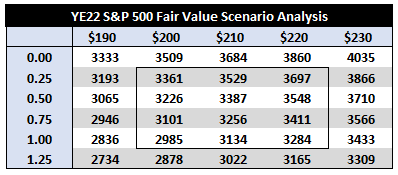 Source: Jefferies Trading Desk, 9/23/22; x-axis: 10yr real rate; y-axis: 2023 S&P 500 EPS
To be sure, we aren’t calling 3,000 for the S&P 500, or any level at all. But one can now see how it could get there by quantifying the narratives.
Disclosures
Past performance is not indicative of future results. This material is not financial advice or an offer to sell any product. The information contained herein should not be considered a recommendation to purchase or sell any particular security. Forward looking statements cannot be guaranteed.
The S&P 500® Index is the Standard & Poor’s Composite Index and is widely regarded as a single gauge of large cap U.S. equities. It is market cap weighted and includes 500 leading companies, capturing approximately 80% coverage of available market capitalization.
Projections or other forward-looking statements regarding future financial performance of markets are only predictions and actual events or results may differ materially.
This commentary offers generalized research, not personalized investment advice. It is for informational purposes only and does not constitute a complete description of our investment services or performance. Nothing in this commentary should be interpreted to state or imply that past results are an indication of future investment returns. All investments involve risk and unless otherwise stated, are not guaranteed. Be sure to consult with an investment & tax professional before implementing any investment strategy. Investing involves risk. Principal loss is possible.
Advisory services are offered through Aptus Capital Advisors, LLC, a Registered Investment Adviser registered with the Securities and Exchange Commission. Registration does not imply a certain level or skill or training. More information about the advisor, its investment strategies and objectives, is included in the firm’s Form ADV Part 2, which can be obtained, at no charge, by calling (251) 517-7198. Aptus Capital Advisors, LLC is headquartered in Fairhope, Alabama. ACA-2209-24.
