Last week, we covered the age old question of “Domestic vs. International”. Let’s make this a bit more intimate with a more recently debated topic, given the rally in cyclicals –Small v. Large. Many of y’all have heard my spiel on this numerous times –get ready for it again.
Over the next few weeks, I’m going to put out a series of analysis on 2021, hitting some of the bigger relative opportunity sets within the equity market:
1. Week 1: Domestic v. International
2. Week 2: Small v. Large
3. Week 3: Value v. Growth
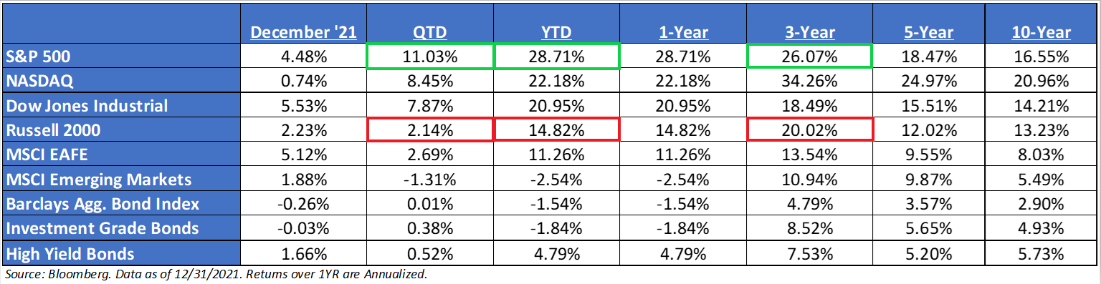
2021 Performance Recap
Both active and passive U.S. Small Cap funds may need to send their clients bumper stickers that say, “Have you Hugged your Small Cap Manager Today?” – U.S. Small Caps have underperformed U.S. Large Caps for five straight years. Even worse, this past year, 2021, U.S. Small Caps underperformed U.S. Large Caps by the largest spread since 1998 – ~14%. But, on the bright side, in years when GDP and inflation are above average (which is expected in 2022), even while the Fed is hiking, small tends to beat large by nearly 400bps. For the first time since ’95 to ’97, U.S. Small Caps delivered three consecutive years of double-digit gains. However, the performance was front-end loaded, as U.S. Small Caps were unable to break out of its 9-month range and only briefly surpassed its 3/15/21 high.
The big thing that stands out to us, from a performance standpoint, is that within U.S. Large, Growth outperformed Value – led by the larger tech names, i.e., NVDA, etc. But that was not the case if you went lower in the market cap spectrum. The Russell 2000 Value (“R2KV”) had quite the comeback vs. the Russell 2000 Growth (“R2KG”) with the difference of 25.5% for the year – being the second-widest in history with only ’00 being bigger. Jefferies went back and looked at periods when U.S. Small Value beat Growth by more than 10%, looking for the next year’s return and we found it still looks good. The R2KV beats the R2KG by an average of 4.7% and did so 9 of 12 periods.
The reason for the underperformance was the fact that the R2KG is littered with non-earners and biotech stocks, which underperformed last year, while the R2KV is heavily weighted in banks, which outperformed. It truly shows that one needs to understand the underlying composition of an index before investing.
h/t Jefferies for a lot of this historical data.
Framing the small-cap landscape:
- The Top 5 names in the S&P 500 have a total market cap of $9.5T, over 3x larger than small caps, these stocks trade at 8.7x price-to-sales vs. <3x for the Russell 2000.
- With record IPO activity, the number of publicly traded stocks rose to 3,384 names, and we will see this number head much higher. Increased IPO action tends to bode well for small cap performance.
- The performance by the R1G was again very concentrated with the Top 10 contributors accounting for 61% of the index’s return. This is two years in a row in which this index was driven by the Top 10.
More importantly, when comparing performance, valuation metrics, and growth compositions for both U.S. Large and U.S. Small, it’s imperative to understand the sectors exposures underneath the hood of each asset class.
Know the Small Cap v. Large Cap Composition:
- Simply put, depending on where you allocation, you have some substantial bets:
- U.S. Large: Investors are betting on Technology, specifically the mega-caps.
- U.S. Small Value: Investors are betting on cyclicals and Financials, i.e., banks and Energy.
- U.S. Small Growth: Betting on non-earners (close to 50% of the index) and biotech /pharmaceuticals.
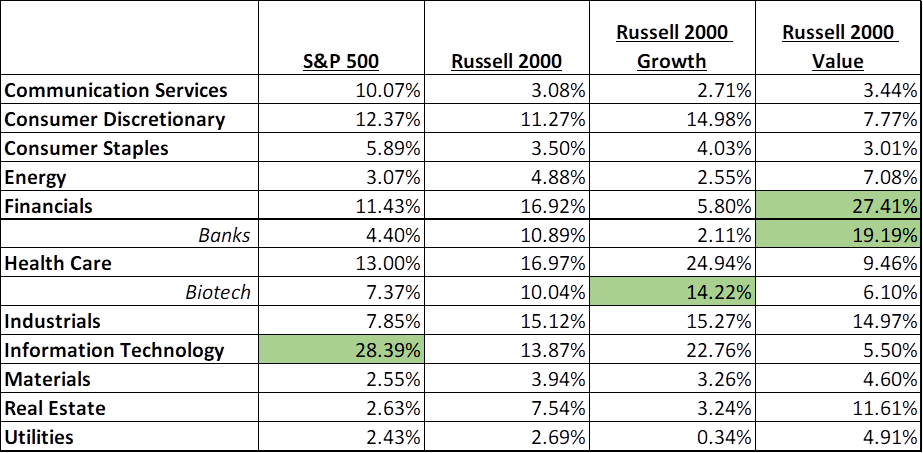 Source: Bloomberg as of 1/17/2022
Yield + Growth Framework:
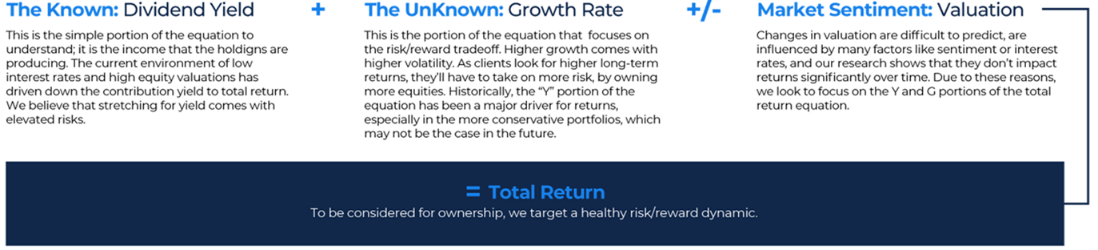
The Known: Yield
Indicated Yield:
-U.S. Large:1.27%
-U.S. Small: 0.98%
The Unknown: Growth
Next 12 Months Growth:
-U.S.Large:9.0%
-U.S. Small: 15.9%
Even though both the earnings and sales revision ratios fell, Q4 and ’22’s earnings growth has held up, at least for now. We see that Q4 numbers have been nudged upward from original estimates in September, with both size segments expected to see growth of 22% during Q4. As for ’22, we did see Small edge lower to 15.9% when it stood at 17.7% as of September 30, while large stayed static at 9.0% for Large.
Market Sentiment: Valuation
Next 12 Months P/E:
-U.S. Large: 21.54x
-U.S. Small: 15.31x
Given the substantial underperformance by small caps, we have seen our relative valuation model continue to fall back to ’20 levels. Historically, U.S. Small Caps have traded, on average, at a 4% premium to U.S. Large Caps. As of January 13, U.S. Small Caps trade at a 29% discount.
Fed tightening cycles have historically been accompanied by positive returns for both small and large caps, but multiple contraction in both size segments. Large cap multiples have typically contracted more: during both the first six months and first 12 months of the tightening cycle (where cycles have lasted 1.5 years on average).
Disclosures:
Past performance is not indicative of future results. This material is not financial advice or an offer to sell any product. The information contained herein should not be considered a recommendation to purchase or sell any particular security. Forward looking statements cannot be guaranteed.
This document may contain certain information that constitutes “forward-looking statements” which can be identified by the use of forward-looking terminology such as “may,” “expect,” “will,” “hope,” “forecast,” “intend,” “target,” “believe,” and/or comparable terminology. No assurance, representation, or warranty is made by any person that any of Aptus’s assumptions, expectations, objectives, and/or goals will be achieved. Nothing contained in this document may be relied upon as a guarantee, promise, assurance, or representation as to the future. Forward looking statements cannot be guaranteed.
Economic and market forecasts presented herein reflect a series of assumptions and judgments as of the date of this presentation and are subject to change without notice. These forecasts do not take into account the specific investment objectives, restrictions, tax and financial situation or other needs of any specific client. Actual data will vary and may not be reflected here. These forecasts are subject to high levels of uncertainty that may affect actual performance. Accordingly, these forecasts should be viewed as merely representative of a broad range of possible outcomes. These forecasts are estimated, based on assumptions, and are subject to significant revision and may change materially as economic and market conditions change.
This commentary offers generalized research, not personalized investment advice. It is for informational purposes only and does not constitute a complete description of our investment services or performance. Nothing in this commentary should be interpreted to state or imply that past results are an indication of future investment returns. All investments involve risk and unless otherwise stated, are not guaranteed. Be sure to consult with an investment & tax professional before implementing any investment strategy. Investing involves risk. Principal loss is possible.
Material presented has been derived from sources considered to be reliable, but the accuracy and completeness cannot be guaranteed. They are based on certain assumptions and current market conditions, and although accurate at the time of writing, are subject to change without prior notice. This material does not constitute a general or personal recommendation or take into account the particular investment objectives, financial situations, or needs of individual investors and should not be relied upon to evaluate the merits of investing in any security. Investors should ensure that they obtain all current available information before making any investment. Investors should also make an independent assessment of the relevant legal, regulatory, tax, credit, and accounting considerations and determine, together with their own professional advisers if investing is suitable to their personal financial goals.
The S&P 500® is widely regarded as the best single gauge of large-cap U.S. equities. There is over USD 11.2 trillion indexed or benchmarked to the index, with indexed assets comprising approximately USD 4.6 trillion of this total. The index includes 500 leading companies and covers approximately 80% of available market capitalization.
The Nasdaq Composite Index measures all Nasdaq domestic and international based common type stocks listed on The Nasdaq Stock Market. To be eligible for inclusion in the Index, the security’s U.S. listing must be exclusively on The Nasdaq Stock Market (unless the security was dually listed on another U.S. market prior to January 1, 2004 and has continuously maintained such listing). The security types eligible for the Index include common stocks, ordinary shares, ADRs, shares of beneficial interest or limited partnership interests and tracking stocks. Security types not included in the Index are closed-end funds, convertible debentures, exchange traded funds, preferred stocks, rights, warrants, units and other derivative securities.
The Dow Jones Industrial Average® (The Dow®), is a price-weighted measure of 30 U.S. blue-chip companies. The index covers all industries except transportation and utilities.
The Russell 2000® Index measures the performance of the small-cap segment of the US equity universe. The Russell 2000® Index is a subset of the Russell 3000® Index representing approximately 10% of the total market capitalization of that index. It includes approximately 2,000 of the smallest securities based on a combination of their market cap and current index membership. The Russell 2000® is constructed to provide a comprehensive and unbiased small-cap barometer and is completely reconstituted annually to ensure larger stocks do not distort the performance and characteristics of the true small-cap opportunity set.
The MSCI EAFE Index is an equity index which captures large and mid-cap representation across 21 Developed Markets countries*around the world, excluding the US and Canada. With 902 constituents, the index covers approximately 85% of the free float-adjusted market capitalization in each country.
The MSCI Emerging Markets Index captures large and mid-cap representation across 26 Emerging Markets (EM) countries*. With 1,387 constituents, the index covers approximately 85% of the free float-adjusted market capitalization in each country.
The Bloomberg Barclays U.S. Aggregate Bond Index is a broad-based benchmark that measures the investment grade, U.S. dollar-denominated, fixed-rate taxable bond market. This includes Treasuries, government-related and corporate securities, mortgage-backed securities, asset-backed securities and collateralized mortgage-backed securities.
The Russell Midcap® Index measures the performance of the mid-cap segment of the US equity universe. The Russell Midcap® Index is a subset of the Russell 1000® Index. It includes approximately 800 of the smallest securities based on a combination of their market cap and current index membership. The Russell Midcap® Index represents approximately 31% of the total market capitalization of the Russell 1000® companies. The Russell Midcap® Index is constructed to provide a comprehensive and unbiased barometer for the mid-cap segment. The index is completely reconstituted annually to ensure larger stocks do not distort the performance and characteristics of the true mid-cap opportunity set.
Investment-grade Bond (or High-grade Bond) are believed to have a lower risk of default and receive higher ratings by the credit rating agencies. These bonds tend to be issued at lower yields than less creditworthy bonds.
Non-investment-grade debt securities (high-yield/junk bonds) may be subject to greater market fluctuations, risk of default or loss of income and principal than higher-rated securities.
The Russell 1000® Index measures the performance of the large cap segment of the U.S. equity universe. The Russell 1000 Index is a subset of the Russell 3000® Index, representing approximately 90% of the total market capitalization of that index. It includes approximately 1,000 of the largest securities based on a combination of their market capitalization and current index membership.
The S&P SmallCap 600® seeks to measure the small-cap segment of the U.S. equity market. The index is designed to track companies that meet specific inclusion criteria to ensure that they are liquid and financially viable.
The Russell 2000® Growth Index measures the performance of the small cap growth segment of the US equity universe. It includes those Russell 2000® companies with higher price-to-value ratios and higher forecasted growth values. The Russell 2000® Growth Index is constructed to provide a comprehensive and unbiased barometer for the small-cap growth segment. The index is completely reconstituted annually to ensure larger stocks do not distort the performance and characteristics of the true small cap opportunity set and that the represented companies continue to reflect growth characteristics.
The Russell Midcap® Growth Index offers investors access to the mid cap growth segment of the U.S. equity universe. The Russell Midcap® Growth Index is constructed to provide a comprehensive and unbiased barometer of the mid cap growth market. Based on ongoing empirical research of investment manager behavior, the methodology used to determine growth probability approximates the aggregate mid cap growth manager’s opportunity set.
The Bloomberg US Mortgage-Backed Securities (MBS) Index tracks fixed-rate agency mortgage-backed pass-through securities guaranteed by Ginnie Mae (GNMA), Fannie Mae (FNMA), and Freddie Mac (FHLMC). The index is constructed by grouping individual TBA-deliverable MBS pools into aggregates or generics based on program, coupon and vintage.
Treasury Inflation-Protected Securities, or TIPS, provide protection against inflation. The principal of a TIPS increases with inflation and decreases with deflation, as measured by the Consumer Price Index.
Bloomberg Barclays Municipal 1-5 Yr TR USD includes all medium and larger issues of U.S. government, investment-grade corporate, and investment-grade international dollar-denominated bonds that have maturities of between 1 and 5 years and are publicly issued.
The Barclays Capital Intermediate U.S. Treasury Index includes all publicly issued, U.S. Treasury securities that have a remaining maturity of greater than or equal to 1 year and less than 10 years, are rated investment grade, and have $250 million or more of outstanding face value.
The Barclays Capital Long U.S. Treasury Index includes all publicly issued, U.S. Treasury securities that have a remaining maturity of 10 or more years, are rated investment grade, and have $250 million or more of outstanding face value.
Advisory services offered through Aptus Capital Advisors, LLC, a Registered Investment Adviser registered with the Securities and Exchange Commission. Registration does not imply a certain level or skill or training. More information about the advisor, its investment strategies and objectives, is included in the firm’s Form ADV Part 2, which can be obtained, at no charge, by calling (251) 517-7198. Aptus Capital Advisors, LLC is headquartered in Fairhope, Alabama. ACA-2201-22.
