We try to be consistent with these notes for transparency regarding the assets we’ve been trusted with. Some of the notes are better than others. I’m not claiming this note will be one of the good ones, but I do claim it to be an important one. For some reason, I feel like it’s the most important one I’ve written. The world has gone crazy. I hope you fight through the length, read it, and reach out with questions.
To start, and from all of us at Aptus – Thank you! If you’re reading this, you’ve most likely placed trust in our people to manage hard earned assets in some way. I’m not blowing smoke when I say that means something, to all of us here, and we work to earn that trust daily.
Ernie Johnson addressed the football team in Tuscaloosa recently and delivered a powerful message. Part of his talk was about his perspective of his job. “I have a ‘Get to’ job…not a ‘Got to’ job.” That mindset is a superpower. Clark Kellogg says, ‘It’s hard to get puffed up when you’re overflowing with gratitude”. I agree. Thank you for the chance to do what we do. We ‘Get to’ wake up daily, work with people we enjoy, and help you navigate an uncertain world with confidence. And boy, is this world uncertain.
I try to keep my opinions muted; this note is a little different on that front.
Hurricane Michael
Hurricane Michael hit the panhandle of Florida in October of 2018. According to Wikipedia, it was the first Category 5 hurricane to strike the contiguous United States since Andrew in 1992. Again, from Wikipedia, “At least 74 deaths were attributed to the storm…Michael caused an estimated $25.1 billion in damages”. The storm left total devastation in his path like I’ve never seen. It made landfall with winds over 200mph. There are not many structures that can handle that type of force and the images that surfaced in the aftermath were and still are heart breaking.
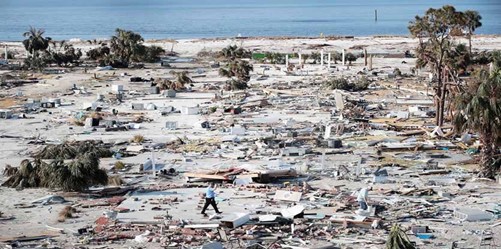 The picture above is a shot of Mexico Beach in 2018, credit to Weather Underground.
DelTech Homes
A friend of mine introduced me to Deltec Homes this past week. No, this isn’t an advertisement for them – you’ll see the dots I’m connecting here shortly.
He asked me if I’d heard of them and he proceeded to show me the picture below and said, “That’s Mexico Beach after Michael. That was the only home left standing in this neighborhood and it had zero structural damage. It just lost some shingles – that’s all.”
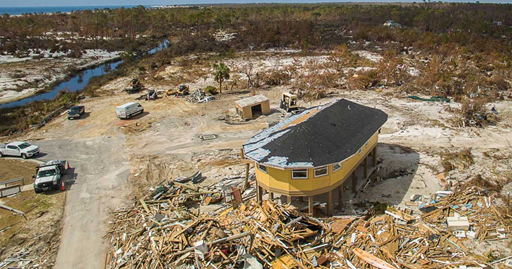 Source: Deltec Homes
Deltec builds homes in a different way. A big selling point for them is that the design difference leads to hurricane resilience. If you visit their site and read any of the information they provide, their track record supports those claims in a powerful way. The picture above is all the evidence that’s needed.
Resilient Portfolios
Deltec approaches home design in the same vein we approach portfolio construction. Our portfolios may not be the best looking home on the block month in and month out, but they are prepared for the storm and resilience will be required when it hits.
This isn’t a note to create fear. It’s the opposite. This note is designed to create confidence in our process. I personally (this is JD) don’t have a dollar invested in anything outside of our strategies – my money is where my mouth is. We actually joke (kinda) that anybody at Aptus has a very limited investment set when it comes to their 401k!
I’m going to get into more data below, but let me answer an obvious question this note will trigger:
- Should we go to cash? We are in an inflationary environment that’s eroding the value of cash like it’s the 70’s. In addition, from our perspective, there’s plenty of opportunity cost in leaving the equity markets still. The market can continue to melt up…remember, we see a Fed that seems to think its sole mandate is to push risk assets higher. Our portfolios are layered with exposure to long volatility and hedges, more so than ever…this has been our solution to the coming storm and that won’t change. It’s allowed us to continue to participate in rising stock markets, avoid bonds, and be prepared for the storm.
Our objective is to preserve and grow investor wealth. The power of compound interest is that it doesn’t take astronomical numbers to accomplish that. Large losses can get in the way of our ability to compound your capital – we understand that clearly and act accordingly.
Drawdown Patrol when Bubbles are everywhere
Hurricanes are the most vicious storms on our planet. NASA describes them as “giant engines that use warm, moist air as fuel”. We know exactly what causes them and that’s what’s different between a hurricane and the storm that’s brewing in the financial world.
Central bank policies (among other things) have created an environment full of the ingredients that can lead to the financial markets equivalent of a hurricane. Valuations are elevated in nearly every asset class, leverage is everywhere, debt loads are heavy, and we think expectations are as frothy as they’ve ever been.
Arguably, 3 major asset classes (stocks, bonds, and real estate) are in bubble territory. We just won’t know exactly what triggers the bubbles to pop but the chance that one bubble popping creates a domino effect is real.
Bubbles contained to one asset class aren’t all that bad – those storms are easily managed – think the tech bubble in 2000. Yes, people lost money, but it was a contained issue, limited to a narrow part of the financial markets. Compare that to the financial crisis when we had the first national real estate bubble pop. It was a devasting blow to nearly every financial asset.
I believe there’s a storm out in the distance and it may not be that far out. The remainder of this note will be in support of that conviction. Remember, we said at the beginning of the year, the path of least resistance is higher. Well, the market is now up over 20% on the year. Could it keep going? We sure hope so, and it wouldn’t surprise us. We just have to acknowledge the data and be logical about positioning in preparation of drawdown.
Drawdowns are defined as the peak to trough pull back in account values. For example, $1mil turning into $700k during market volatility would be a 30% drawdown. There’s a volatility tax associated with drawdowns that creates friction towards our goal of compounding capital. This is because losses hurt worse than gains.
Take the example above – 30% down, followed by 30% up, still leaves the account at $910k…or $90k away from where we started. A loss requires an even larger gain (roughly 44% in this example) just to get back to break even.
While I focused on the negative arithmetic associated with drawdowns, it’s worth mentioning that the behavioral impact can be even worse…that’s for a different note.
Everything is a DCF
A stock is a claim on the future cash flows of a business. That stock’s value is derived by discounting those cash flows back to today’s present value. We’ve talked about this before.
Michael Mauboussin of Morgan Stanley recently put out a note titled, ‘Everything is a DCF Model – a Mantra for Valuing Cash Generating Assets’. It mirrored some of our notes, with the theme being a stock is simply a claim on future cash flows. And that value always comes back to the present value of those future cash flows.
At the risk of upsetting efficient market advocates, the price of a stock can differ from the net present value of future cash flows, sometimes significantly. The true value of a stock is a moving target for sure, but the point is that price can deviate for a time, until it can’t.
The ‘everything is a DCF’ truth is a magnet that pulls prices up when they are too low and pulls prices lower when they are too high. What follows are charts and commentary illustrating today’s market…you tell me which direction the magnet is likely to pull prices. To us, it’s pretty apparent we are in the most expensive US equity market we’ve ever witnessed.
For the remainder, keep in mind, most refer to valuations in the stock market through multiples. For example, a stock leaves $2.00 a share in net income or earnings on the bottom line and the stock trades at $20 a share. That stock would trade at a P/E multiple of 10. The concept of multiples is critical to the rest of this note.
Let this chart sink in. What you are looking at is the total market cap (fancy way of saying value) of stocks trading at a Price to Sales multiple OVER 20x. I’m going to explain that, but notice that today’s aggregate market cap of stocks trading at this multiple is about a trillion dollars more than in 2000!
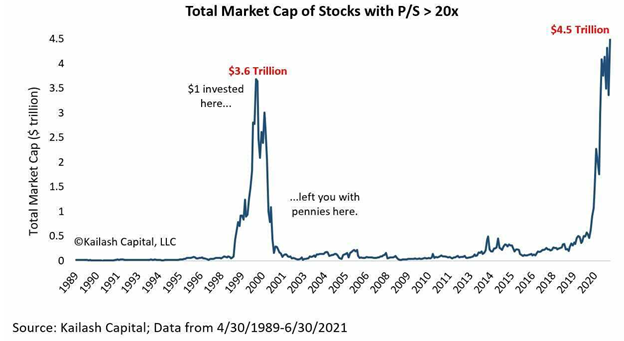
Let’s imagine a scenario where you run a small business that generates $1mil of sales annually. Would you sell your business to somebody willing to pay you $25mil? The answer should be heck yes.
According to Bloomberg, the average net profit margin for all S&P 500 companies was about 8% in 2020. That means for every $1mil generated of sales the average company leaves $80k of net income on the bottom line. Let’s assume your business is much more profitable than the average company which would demand a higher multiple. Your net margins are 30%. That would leave $300k on the bottom line each year. That’s money that’s available to the people that own your stock…. remember, a stock is a claim on a business cash flow, and you have $300k to distribute to shareholders.
The people that just paid you $25mil have 1.2% of their purchase price…which is pre-tax by the way…to show for it at the bottom line each year. If there’s a loser and a winner in all transactions, I’d say you came out on top here!
I say all that to ask, is the reason more equities trade at these insane valuations than ever before because expected cash flows are about to explode higher? OR, have prices gotten a little too rich?
Buffett and Other Multiples
Warren Buffett has famously used the ratio of Market Cap/GDP as his preferred metric for a gauge of market valuations. In his words, this ratio is “probably the best single measure of where valuations stand at any given moment.”
You don’t even have to know what market cap or GDP means to read the chart below. It’s 87% above the long term trend line.
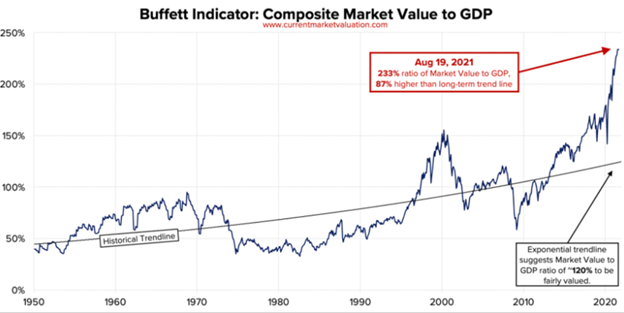 Source: CurrentMarketValuation.com August 2021
Check out the image below from Strategas. It’s a quick look at several multiples relative to historical values. Cheap is green. Expensive is Red. No further comment here.
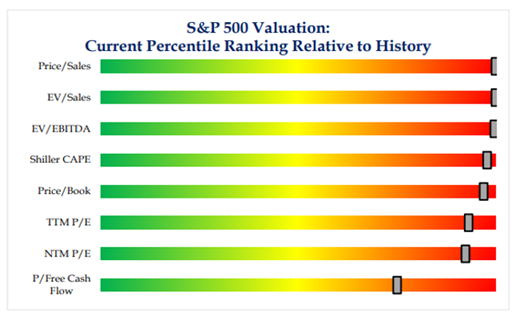 Source: Strategas August 2021
While the charts above focus more so on the equity markets, we’ve seen Real Estate go crazy as well. To add further warm air to these ingredients for a serious storm, bonds are the MOST expensive asset class I can find across the globe. I’ve left out much color on those as this note is long enough.
Conclusion
In a bubbly environment, the screaming buy is…you guessed it, volatility. The chart below is busy, but the message is clear – volatility is cheap. I’d make the argument that it’s extremely cheap given the current backdrop.
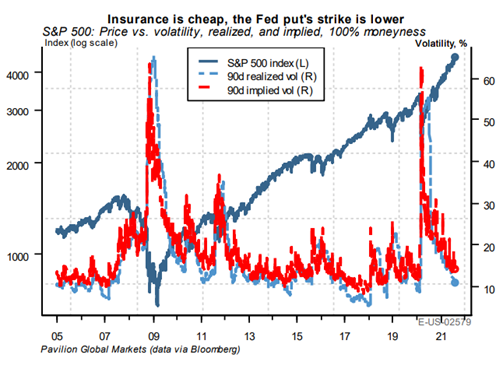 Data as of August 2021
I’m closing on a high note here, I promise.
Our portfolios are full of long volatility exposure, more than ever. We view volatility as an asset class, and its exposure in our portfolios provides protection against the inevitable storm.
Not only does it provide protection, but it also provides the potential for dry powder to be created and deployed when the bubbles pop (cash to buy assets at cheaper levels). That’s the silver lining of lower valuations as prices fall…future returns can be higher if you have the cash to deploy.
Long volatility’s presence in our portfolios changes the game and should bring confidence. You don’t have to worry about clients panicking with this approach. Other investors might, but not you.
This is nothing new. It’s how markets have always worked. Today’s environment is just an extreme thanks to quantitative easing.
The Fed has forced cash towards zero yield, while providing the illusion that stocks only go up. Nobody wants to hold cash when stocks only go up. Something will cause the preference for cash to change. Valuations across the board seem to have an aggressive numerator on top of an optimistic denominator. I’m not sure what the trigger will be, but it will be something.
I believe we offer one of the few solutions that seeks to provide the ability to continue to ride the wave higher while staying prepared for the inevitable storm. Resilient portfolios on constant patrol for drawdown. Our antennas are up and our exposure to volatility is purposeful.
Like Deltec, our design is different, and that difference creates resiliency. What’s happened matters less than what’s next. Rearview vs windshield.
It’s just a matter of time before the world realizes that everything is a DCF.
Disclosures
Past performance is not indicative of future results. This material is not financial advice or an offer to sell any product. The information contained herein should not be considered a recommendation to purchase or sell any particular security. Forward-looking statements cannot be guaranteed.
This commentary offers generalized research, not personalized investment advice. It is for informational purposes only and does not constitute a complete description of our investment services or performance. Nothing in this commentary should be interpreted to state or imply that past results are an indication of future investment returns. All investments involve risk and unless otherwise stated, are not guaranteed. Be sure to consult with an investment & tax professional before implementing any investment strategy. Investing involves risk. Principal loss is possible.
Advisory services offered through Aptus Capital Advisors, LLC, a Registered Investment Adviser registered with the Securities and Exchange Commission. Registration does not imply a certain level or skill or training. More information about the advisor, its investment strategies and objectives, is included in the firm’s Form ADV Part 2, which can be obtained, at no charge, by calling (251) 517-7198. Aptus Capital Advisors, LLC is headquartered in Fairhope, Alabama. ACA-2108-16.