Very few days pass that don’t involve a cast net being thrown at our house. I’m not sure I can think of anything I’d rather do than throw the net with my crew. My kids have grown up learning early and often because in lower Alabama, it’s a necessary skill if you enjoy organic fish for supper. Live shrimp on a popping cork is a cheat code in these waters.
I have made plenty of mistakes as a father, and I’m sure I’m not done making them, but when I come home from work to cast nets laying all over and my kids tell me the mullet are running up the creek, it sure feels like I’m getting something right.

The size of a net is measured by the horn to the lead line. When thrown right, the net will open like a ‘donut’ and the diameter of the spread is 2x the size of the net. So, an 8-foot net will have a 16-foot diameter. Kids tend to learn to throw on a 4-foot net. As they get older, stronger, and better at it…they will step up in size.
I usually help my kids out until they ask me to throw. The larger the net the more water you cover and the greater chance you have of catching something. Those few seconds from when the net hits the water to when the first glimpse of the haul can be seen are what it’s all about. The larger the net, the greater the mystery in that moment. They know my net tends to deliver the most surprises.
Now, let’s tie this random cast net discussion into your portfolios and today’s markets.
The Price of Expectations
Implied volatility is a measure of the market’s expectations of potential outcomes. If the market expects a wild ride, implied volatility will be elevated. If the market does not expect much in the form of surprises, implied volatility will be low.
Volatility is a tool that shapes our approach to portfolio construction, and we access volatility through the options market. In the options market, the expectations of outcomes are an important input into the pricing of options. Lower implied volatility means cheaper options and higher implied volatility means more expensive.
Probability Density and Implied vs. Realized
An 8-foot cast net is more expensive than a 4-foot net. The larger net is priced for a broader array of outcomes. In more fancy words, the probability density around the current price is wider.
Option buyers can win in several ways (they can lose in several ways too). If you pay for the 4-foot net and it provides the outcome of an 8-foot net, that’s a pretty good deal. Same thing applies in the options market. If you buy an option at lower implied volatility and the realized or actual volatility ends up being much greater, you win.
To say that again – if you own an option and realize volatility surpasses implied volatility it’s a good thing.
Today’s Market
Here’s the takeaway from this section: vol is cheap!
The market appears to be pricing like a 4-foot cast net. That’s a good thing when you are buying options.
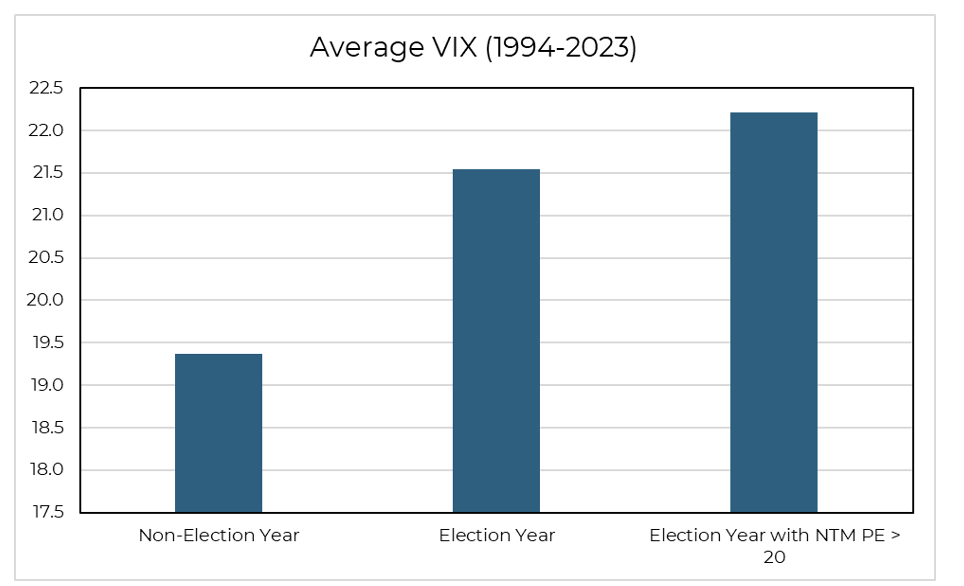
As of right now, the VIX sits at ~13. VIX is an index that measures the market’s expectations of near-term price changes in the S&P 500. It’s a forward projection of volatility and is highly relevant to the conversation today.
 Source: Aptus as of January 2024
The team put this chart together to illustrate the point. We are in an election year, in case you didn’t know, and the forward PE is greater than 20. We aren’t making a prediction. We don’t need to. Simply pointing out, the current VIX level appears to be low.
What This Means to Your Portfolios
We want to own more stocks and less bonds than a relevant benchmark. We want to make this allocation shift at each risk tolerance level.
The goal is to improve a portfolio’s ‘Yield + Growth’ and position your portfolios to be better in the tails.
We believe these objectives are accomplished by harnessing volatility. Specifically, we own hedges.
Hedges cost us to own them. They are negative carry holdings. That’s the give. The get is that hedges do not have correlation (or basis) risk. Meaning, we know the correlation of a hedge. If markets go down, hedges go up.
Hedges are designed to protect against the specific scenario that worries clients and cripples the math behind compounded returns. And they often get mistakenly judged for their siloed negative returns. As David Dredge says, you don’t judge a goalie by their ability to score goals. It’s the concept of Team of Players.
The presence of hedges, and their embedded convexity, impacts our asset allocation. It’s at the allocation level where you win the game of compounded returns.
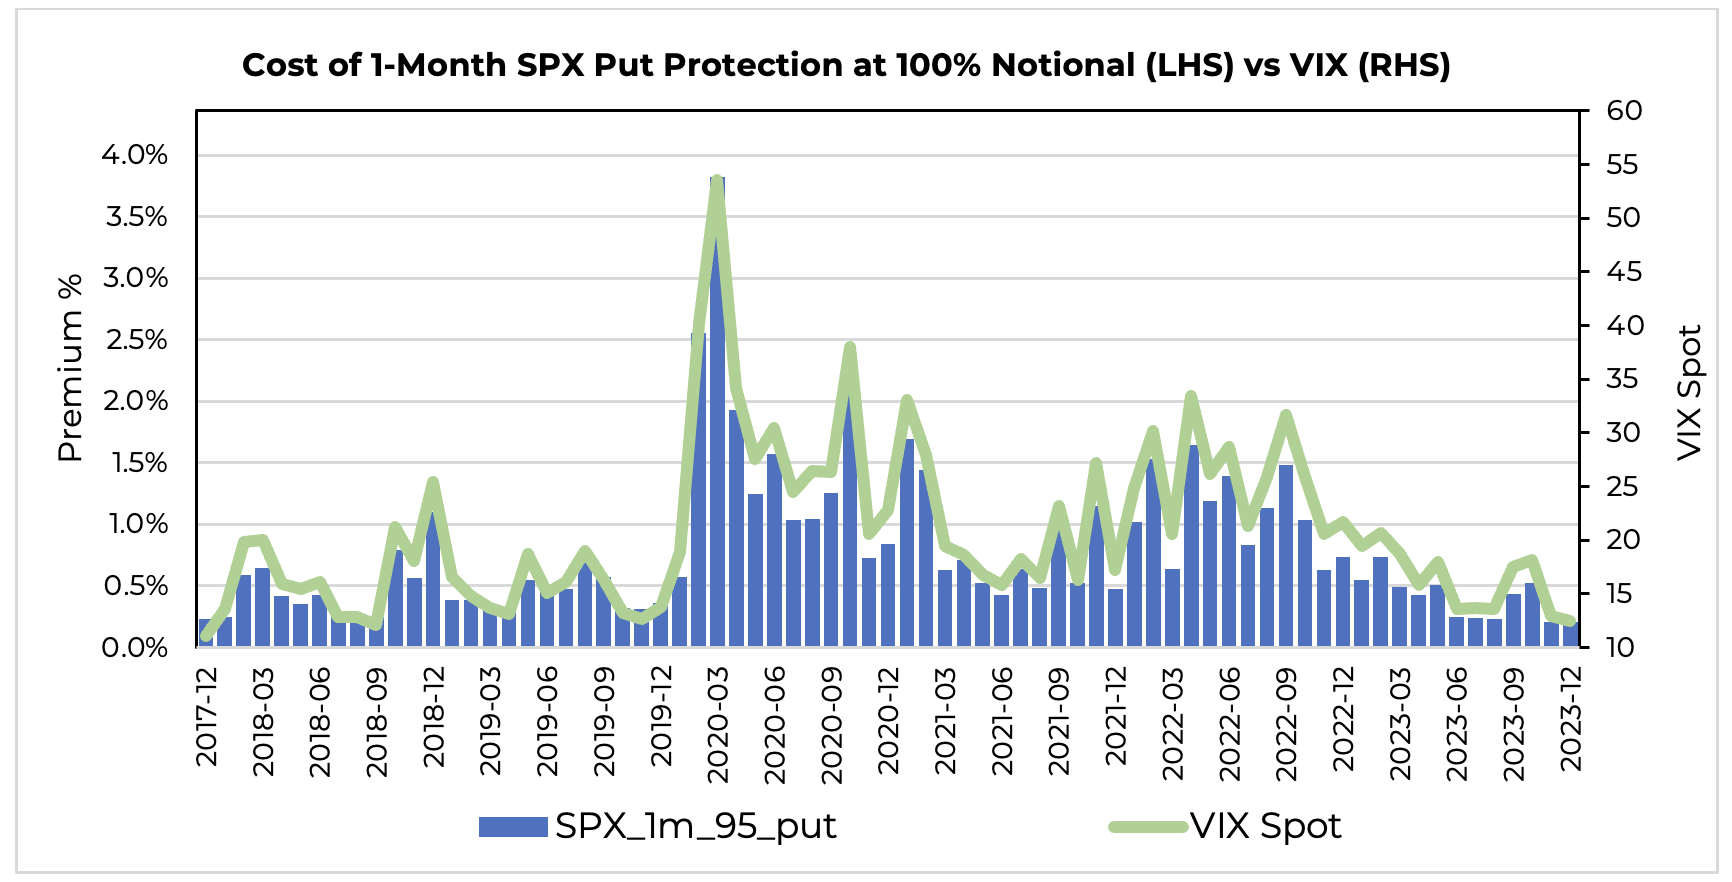
While the chart below may be busy, the takeaway I want you to see is the left vertical axis. What that’s measuring is the cost of protecting a portfolio, with a put option that expires in 1 month that is 5% away from the current market price.
In other words, if you own $100 of the S&P 500, it costs less than 50 cents to buy enough of a put option that’s 5% away from the current market price to protect the entirety of your $100. If that option talk is confusing, the cost of protection hasn’t been this cheap since 2017. That’s what matters.
 Source: Aptus as of 02.02.2024
Closing
The market is pricing volatility as if the range of outcomes is like that of a 4-foot cast net. Maybe that’s right, maybe it’s not.
We talk about seeking to be ‘better in the tails’. That means, if markets rip higher (right tail), we want to produce compelling upside capture vs a benchmark. If markets rip lower (left tail), we want to protect capital better than others.
Our upside capture should be attributed to our allocation, by owning more stocks and less bonds. Our downside capture should be attributed to fund selection, by owning strategies that deploy hedges.
In either tail, cheap protection sure makes our approach more compelling. We are excited for 2024.
As always, thank you for your trust and please don’t hesitate to reach out with any questions.
Disclosures
Past performance is not indicative of future results. This material is not financial advice or an offer to sell any product. The information contained herein should not be considered a recommendation to purchase or sell any particular security. Forward looking statements cannot be guaranteed.
This commentary offers generalized research, not personalized investment advice. It is for informational purposes only and does not constitute a complete description of our investment services or performance. Nothing in this commentary should be interpreted to state or imply that past results are an indication of future investment returns. All investments involve risk and unless otherwise stated, are not guaranteed. Be sure to consult with an investment & tax professional before implementing any investment strategy. Investing involves risk. Principal loss is possible.
Advisory services are offered through Aptus Capital Advisors, LLC, a Registered Investment Adviser registered with the Securities and Exchange Commission. Registration does not imply a certain level or skill or training. More information about the advisor, its investment strategies and objectives, is included in the firm’s Form ADV Part 2, which can be obtained, at no charge, by calling (251) 517-7198. Aptus Capital Advisors, LLC is headquartered in Fairhope, Alabama. ACA-2402-5.
