Developments over the Past Month:
Monthly Recap:
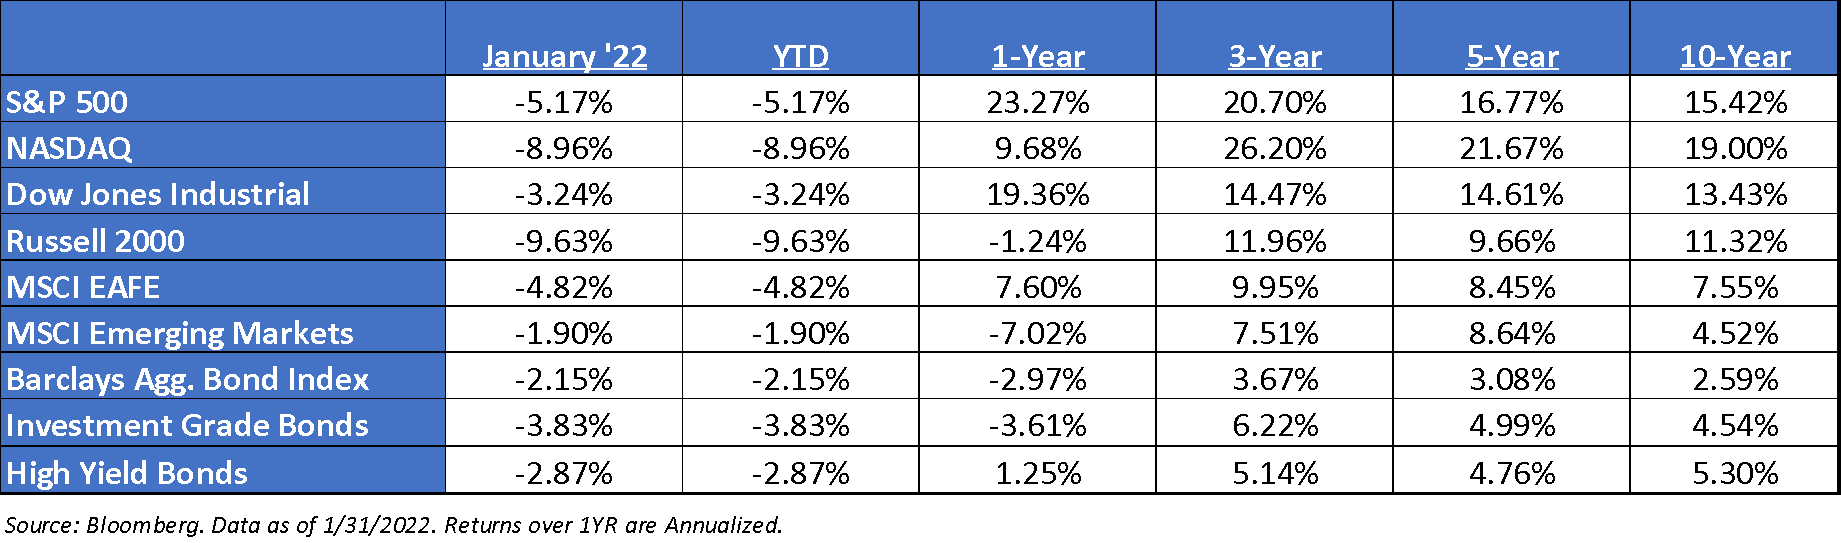
We’ve seen big moves in equities to start the year. This has been the worst January for the S&P 500 since 2009 while at the same time it’s been the best start to the year for Value stocks in decades. We expect market volatility to remain high and headline-driven for a while longer.
Enter Volatility:
The new year is certainly off to a volatile start. The huge month-end rallies continued a trend of big swings that has defined markets since the Federal Reserve signaled its intention to tamp down inflation that had swelled to the fastest since the early 1980s. In one session, the Nasdaq 100 erased a loss of almost 5%, while the S&P 500 staged three straight days with swings that topped 3%. Markets are finding themselves in a tug of war between strong earnings and economic growth, and the specter of the Fed raising rates. And not to mention a normalization of egregious valuations.
Equity Fundamentals are Normalizing:
As equity valuations come under scrutiny amid the rapid rise in real rates, investor focus will increasingly assess whether earnings growth can continue to lead the market higher. We are focusing on Q4 2021 earnings, which has had a strong start from MSFT and AAPL. As of year-end, the consensus estimates expect S&P 500 EPS to increase +9% in 2022. We believe there is upside to consensus estimates but expect the frequency and magnitude of EPS beats will moderate from 1H 2022. There remain a few key risks to watch: (1) Supply chains, (2) oil, (3) labor costs, (4) Fed tapering cadence, (5) Omicron variant effects, and (6) China growth.
The Fed Update:
During the January meeting, the Fed did nothing to contain market expectations to four (4) rate hikes this year, effectively inviting the market to price in even more, hence why the market saw a swift move. Furthermore, Powell also hinted that he will be revising up his 2022 inflation forecast, which will pressure the dots higher. Thus, the March SEP is likely to show four (4) hikes at a minimum, and possibly more (up from three in December). Fortunately, the FOMC’s balance sheet guidance was a bit more dovish, i.e., helpful in cutting the tail risks. The Fed intends to shrink the balance sheet in a “predictable manner” and “primarily” through runoff, which makes asset sales very unlikely in the first year.
Rate Hikes:
At the same time, market participants are pricing in the potential for as many as five rate hikes by the Federal reserve this year, with some looking for the first hike in March to be 50 basis points. We continue to think that the hawkish estimates will prove to be overblown. The current Federal Reserve has been both hyper transparent, and steadfastly deliberate in their actions. The potential for them to do anything that surprises the markets seems unlikely.
Yield Curve Flattening & What It’s Telling Investors:
The yield curve’s flattening is a sign of growing concern that the Fed is going to hike too much and break something. The curve is not inverted, which would signal the market believes things are already breaking, but it is rapidly moving toward that level. As the short end of the curve rises, so too do the odds of rate hikes. The market has five (5) rate hikes priced in by the end of 2022. A sixth hike is priced in by March 2023. The market still sees the terminal rate settling in around 1.75% or 2.00%.
Fourth Quarter Earnings Season Has Begun:
Fourth-quarter earnings season has been constructive. So far, earnings growth is coming in at 25.3% year over year, with companies in aggregate reporting earnings 4.1% above expectations. That’s in line with the long-term average beat rate, but well below the 16% average beat in the previous four quarters. Companies that have reported growing profit margins in the quarter have seen their stocks rise about 1% the next day, on average, with those that beat earnings climbing 1.4% and those that missed slipping 1.6%.
Earnings:
2021 S&P 500 operating earnings = $209. 2022 = $224. 2019 = $165. Bottoms-up for 2020 = $142.
Valuations:
S&P 500 Fwd. P/E is at 20.3x. EAFE is 14.3x forward P/E, while EM is at 11.7x. R1V is 15.9x v. R1G at 27.1x.
Client Talking Points – February 2022:
- Though it wasn’t passed in 2021, President Biden outlined the biggest expansion of the federal government matched with the largest tax increase since 1968. Biden senses the post-COVID era is a once-in-a-generation opportunity to massively restructure US fiscal, monetary, and social policy. In our opinion, this is a big experiment. We’ll wait to see how the Build Back Better plan and taxes pan out. It appears that this dramatic change in societal direction has proved to be difficult for some moderate Democrats to get on board, i.e., Manchin.
- We have expected bond yields to reflate as the pandemic improves and economic activity begins to normalize. The spread on the 2s and 10s has historically expanded as wide as 300 bps (~73bps as of January month-end). This year’s peak was in March at ~160bps. Real Rates have never been negative outside some sort of Quantitative Easing environment.
- This past year was led by a bunch of one-hit wonders, i.e., most likely not repeatable – a very dovish Fed, a successful economic reopening, and $8T of stimulus. None of which are expected to sustainably pump liquidity into the market next year. In 2022, the market may have to navigate a slew of negative headlines – increased taxes, higher-than-expected inflation, continued supply bottlenecks, and the possibility of more variants. All in all, we believe that this can create an environment of increased volatility.
- We feel it will be worth watching the general trend of economic and fundamental data, and when it will begin to decelerate.
- Longer-term, we believe valuations and bond yields will eventually matter, and both will lower expected returns for balanced portfolios.
Disclosures
Aptus Capital Advisors, LLC is a Registered Investment Advisor (RIA) registered with the Securities and Exchange Commission and is headquartered in Fairhope, Alabama. Registration does not imply a certain level of skill or training. For more information about our firm, or to receive a copy of our disclosure Form ADV and Privacy Policy call (251) 517-7198 or contact us here. Information presented on this site is for educational purposes only and does not intend to make an offer or solicitation for the sale or purchase of any securities.
This commentary offers generalized research, not personalized investment advice. It is for informational purposes only and does not constitute a complete description of our investment services or performance. Nothing in this commentary should be interpreted to state or imply that past results are an indication of future investment returns. All investments involve risk and unless otherwise stated, are not guaranteed. Be sure to consult with an investment & tax professional before implementing any investment strategy.
Past performance is not indicative of future results. This material is not financial advice or an offer to sell any product. The information contained herein should not be considered a recommendation to purchase or sell any particular security. Forward looking statements cannot be guaranteed.
The S&P 500® is widely regarded as the best single gauge of large-cap U.S. equities. There is over USD 11.2 trillion indexed or benchmarked to the index, with indexed assets comprising approximately USD 4.6 trillion of this total. The index includes 500 leading companies and covers approximately 80% of available market capitalization.
The Nasdaq Composite Index measures all Nasdaq domestic and international based common type stocks listed on The Nasdaq Stock Market. To be eligible for inclusion in the Index, the security’s U.S. listing must be exclusively on The Nasdaq Stock Market (unless the security was dually listed on another U.S. market prior to January 1, 2004 and has continuously maintained such listing). The security types eligible for the Index include common stocks, ordinary shares, ADRs, shares of beneficial interest or limited partnership interests and tracking stocks. Security types not included in the Index are closed-end funds, convertible debentures, exchange traded funds, preferred stocks, rights, warrants, units and other derivative securities.
The Dow Jones Industrial Average® (The Dow®), is a price-weighted measure of 30 U.S. blue-chip companies. The index covers all industries except transportation and utilities.
The Russell 2000® Index measures the performance of the small-cap segment of the US equity universe. The Russell 2000® Index is a subset of the Russell 3000® Index representing approximately 10% of the total market capitalization of that index. It includes approximately 2,000 of the smallest securities based on a combination of their market cap and current index membership. The Russell 2000® is constructed to provide a comprehensive and unbiased small-cap barometer and is completely reconstituted annually to ensure larger stocks do not distort the performance and characteristics of the true small-cap opportunity set.
The MSCI EAFE Index is an equity index which captures large and mid-cap representation across 21 Developed Markets countries*around the world, excluding the US and Canada. With 902 constituents, the index covers approximately 85% of the free float-adjusted market capitalization in each country.
The MSCI Emerging Markets Index captures large and mid-cap representation across 26 Emerging Markets (EM) countries*. With 1,387 constituents, the index covers approximately 85% of the free float-adjusted market capitalization in each country.
Investment-grade Bond (or High-grade Bond) are believed to have a lower risk of default and receive higher ratings by the credit rating agencies. These bonds tend to be issued at lower yields than less creditworthy bonds.
Non-investment-grade debt securities (high-yield/junk bonds) may be subject to greater market fluctuations, risk of default or loss of income and principal than higher-rated securities.
Nasdaq-100® includes 100 of the largest domestic and international non-financial companies listed on the Nasdaq Stock Market based on market capitalization.
The Bloomberg Barclays U.S. Aggregate Bond Index is a broad-based benchmark that measures the investment grade, U.S. dollar-denominated, fixed-rate taxable bond market. This includes Treasuries, government-related and corporate securities, mortgage-backed securities, asset-backed securities and collateralized mortgage-backed securities. ACA-2202-1.
