The recent market volatility has been keeping us busy, or maybe the fact that I’m still celebrating a Cincinnati Bengals playoff victory against the first-seeded Tennessee Titans last week – WHY NOT US? Speaking of Value, at the beginning of the year, the Cincinnati Bengals were not projected to come close to winning the AFC North, let alone making it to the AFC Championship. One could say, in Vegas terminology, that the Bengals have been trading at a Value all season – Value that has proven to be victorious. Yet, the Bengals weren’t the only Value trade winning – in fact, to begin 2022, the Value-style of investing has been all of the rage across all market cap spectrums.
After the recent deleveraging event to start the year in the market, which statement is correct? Please feel free to respond:
- Value Continues to Trade at a Value!
- After the recent rout, Growth is on sale!
Over the next few weeks, I’m going to put out a series of analysis on 2021, hitting some of the bigger relative opportunity sets within the equity market:
- Week 1: Domestic v. International
- Week 2: Small v. Large
- Week 3: Value v. Growth
Value v. Growth Performance Recap:
To be quite honest, doing a 2021 performance recap on Value vs. Growth is stale, especially given how the market has performed to begin the year. So let’s break out the performance periods and do a recap on both:
- 2021 Performance Recap, and
- YTD 2022.Performance Recap
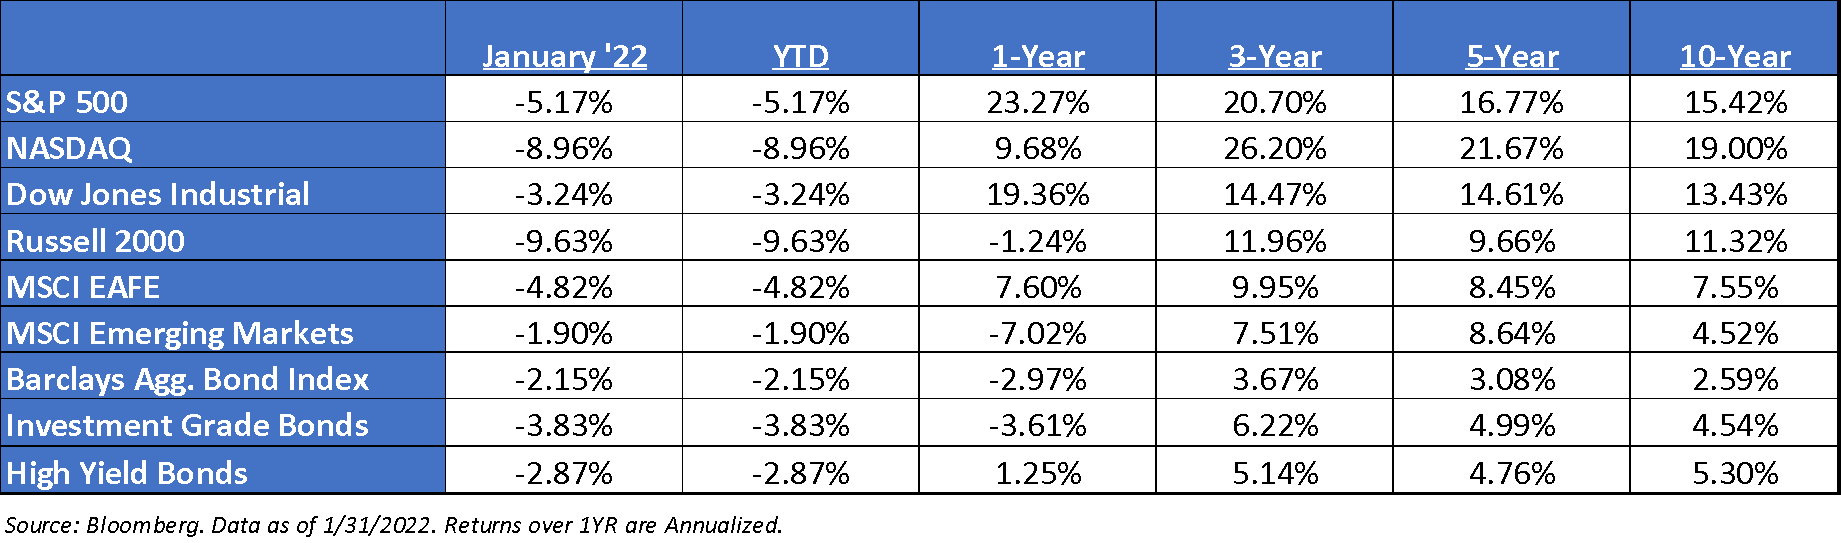
2021 Performance Recap:
The big thing that stood out to us, from a performance standpoint, is that within U.S. Large, Growth outperformed Value – led by the larger tech names, i.e., NVDA, etc. This has definitely been the microcosm for performance over the past few years, as to why Growth has been all the rave – it’s easy – just own the mega-cap companies, which tend to skew towards the Growth-style bias. It’s no secret the likes of AAPL, GOOGL, MSFT, NVDA, etc. have been the darlings of the market for quite some time. But Growth outperforming Value was not the case if you went lower in the market cap spectrum. The Russell 2000 Value (“R2KV”) had quite the comeback vs. the Russell 2000 Growth (“R2KG”) with the difference of 25.5% for the year – being the second-widest in history with only ’00 being bigger. Jefferies went back and looked at periods when U.S. Small Value beat Growth by more than 10%, looking for the next year’s return and we found it still looks good. The R2KV beats the R2KG by an average of 4.7% and did so 9 of 12 periods.
The reason for the underperformance was the fact that the R2KG is littered with non-earners and biotech stocks, which underperformed last year, while the R2KV is heavily weighted in banks, which outperformed. It truly shows that one needs to understand the underlying composition of an index before investing.
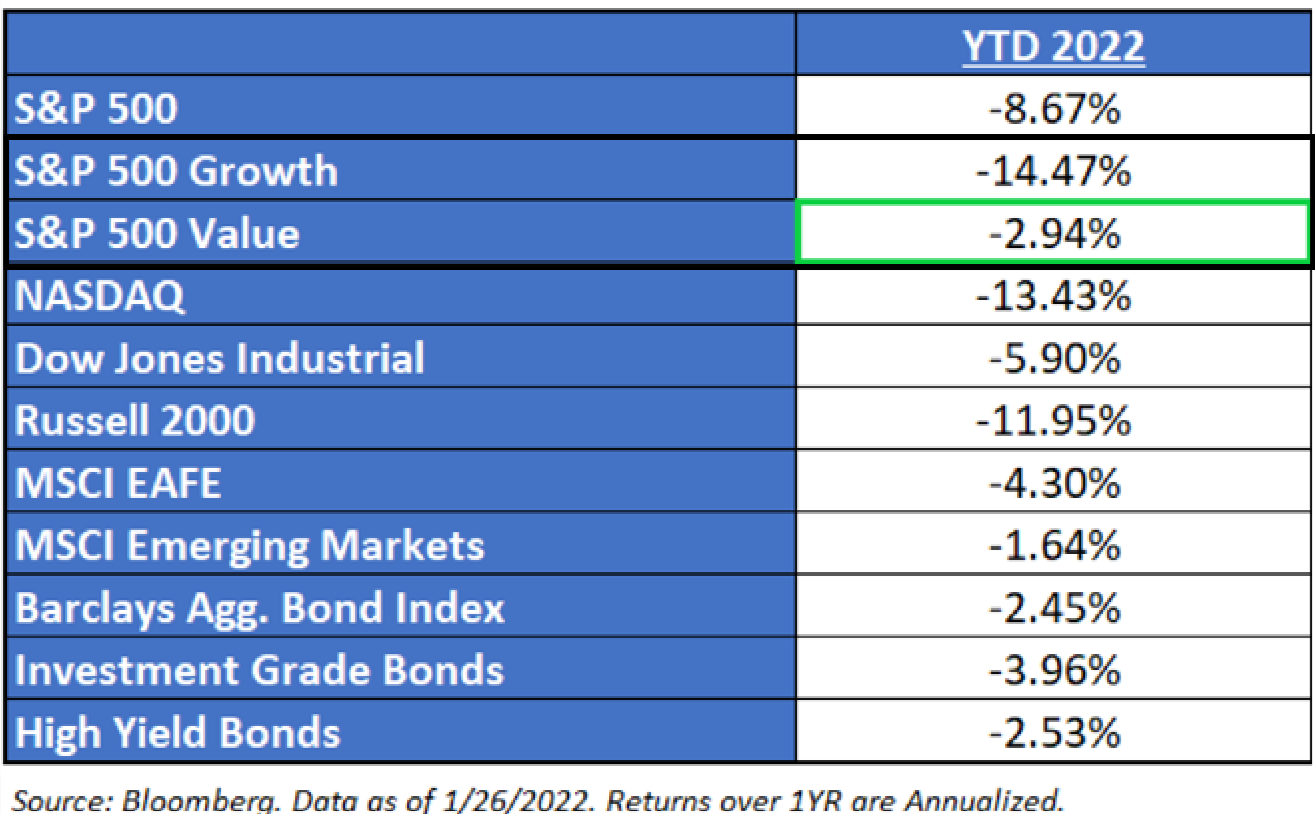
YTD 2022 Performance Recap:
Much of the cyclical areas of the market that rallied last year have extended their dominance in 2022. Year to date, this Value rotation is beating Growth by a staggering 11.53%. This is in the 99th percentile of monthly Value returns over the past 44 years.
Firstly, if real yields continue to normalize as inflation moderates, we believe Value is likely to outperform further. Secondly, the earnings momentum which Value had all throughout 2021 is still in place for 2022. Cheap stocks earnings are still being net upgraded more than expensive stocks. The earnings revisions, on balance, for Energy, Materials, Financials is still in positive territory – meaning these stocks are being upgraded faster than Growth stocks. Valuation multiples for the Value sectors have not yet recovered to pre-pandemic levels, despite the rotation- something that can’t be said for Growth. Thus, this is why we have seen this parabolic shift in relative performance YTD.
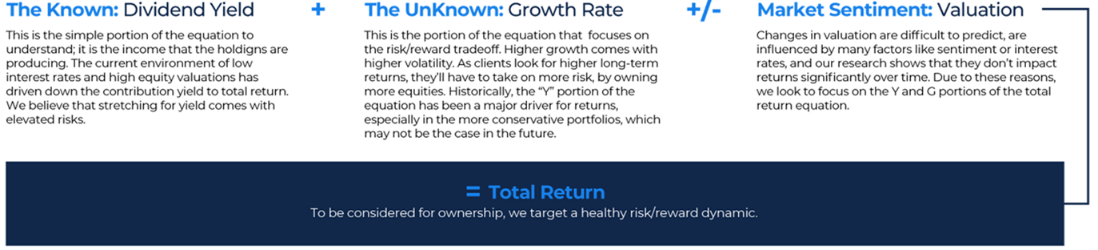
The Known: Yield
Indicated Yield:
-U.S. Large Growth: 0.55%
-U.S. Large Value: 2.18%
-S&P 500: 1.30%
The Unknown: Growth
NTM Growth:
-U.S. Large Growth: +14.41%
-U.S. Large Value: +13.96%
Value stocks, which tend to be more cyclical than Growth stocks, are slated to grow faster than secular growth stocks this year. In fact, many Wall Street analysts are speculating that this trend should continue into 2023. Thus, I’m somewhat skeptical of Bloomberg’s growth rates above.
Market Sentiment: Valuation
NTM P/E:
-U.S. Large Growth: 34.14x
-U.S. Large Value: 15.34x
-S&P 500: 19.98x
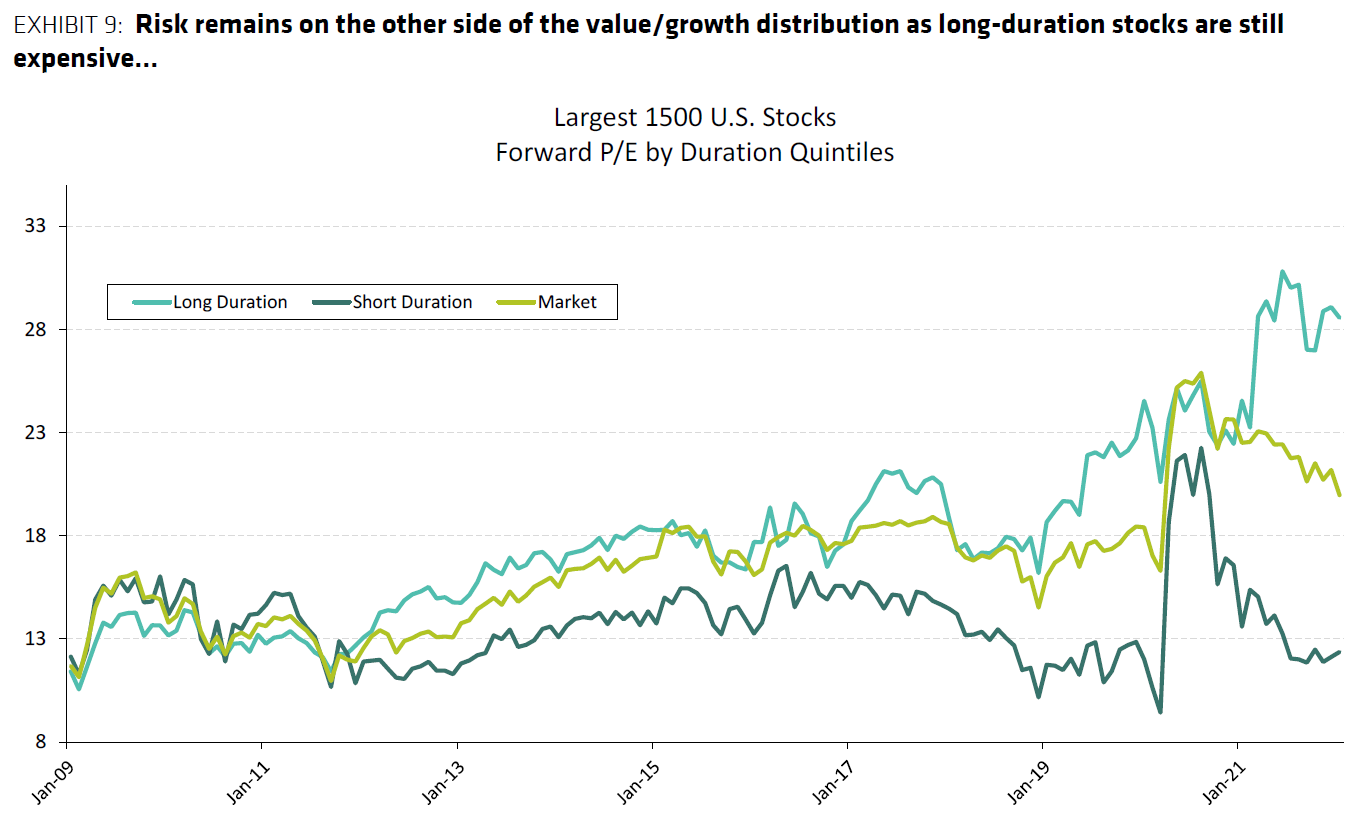
The forward p/e for the S&P 500 Value index relative to the S&P 500 Growth index shows that value still remains more attractive, albeit less so than it was just two short months ago. However, the valuation gap has closed rather quickly, with value holding up significantly better over the last four weeks. This is not too dissimilar to what occurred in 2000 when the tech bubble burst.
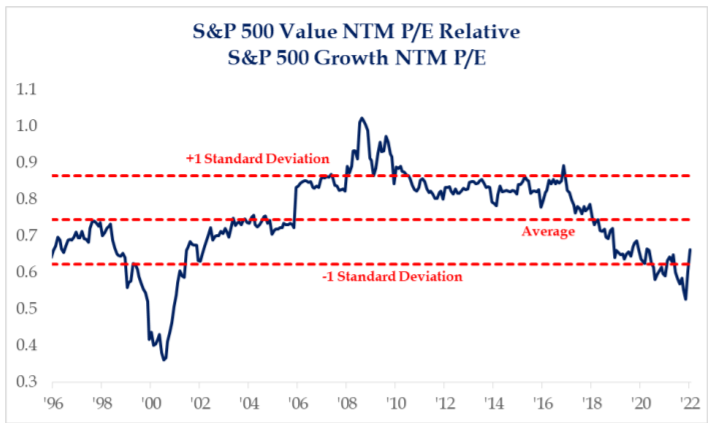
Source: Strategas, Data as of 1/26/2022
Source: Bernstein, Data as of 1/27/2021
Conclusion:
As of today, we prefer Value over Growth, even after the very strong comeback by the style last year. When we have seen big rebounds by Value, the momentum tends to continue, and the macro backdrop of above 4% GDP growth really supports the style. We also find that Value cycles do not end when their relative valuation trades in the 27th percentile versus history. Lastly, the earnings revision ratio is holding up slightly better for Value, and we suspect that it could potentially have more upside to its earnings thanks to low-expectations in Financials, and Energy.
Disclosures
Aptus Capital Advisors, LLC is a Registered Investment Advisor (RIA) registered with the Securities and Exchange Commission and is headquartered in Fairhope, Alabama. Registration does not imply a certain level of skill or training. For more information about our firm, or to receive a copy of our disclosure Form ADV and Privacy Policy call (251) 517-7198 or contact us here. Information presented on this site is for educational purposes only and does not intend to make an offer or solicitation for the sale or purchase of any securities.
This commentary offers generalized research, not personalized investment advice. It is for informational purposes only and does not constitute a complete description of our investment services or performance. Nothing in this commentary should be interpreted to state or imply that past results are an indication of future investment returns. All investments involve risk and unless otherwise stated, are not guaranteed. Be sure to consult with an investment & tax professional before implementing any investment strategy.
Past performance is not indicative of future results. This material is not financial advice or an offer to sell any product. The information contained herein should not be considered a recommendation to purchase or sell any particular security. Forward looking statements cannot be guaranteed.
The S&P 500® is widely regarded as the best single gauge of large-cap U.S. equities. There is over USD 11.2 trillion indexed or benchmarked to the index, with indexed assets comprising approximately USD 4.6 trillion of this total. The index includes 500 leading companies and covers approximately 80% of available market capitalization.
The Nasdaq Composite Index measures all Nasdaq domestic and international based common type stocks listed on The Nasdaq Stock Market. To be eligible for inclusion in the Index, the security’s U.S. listing must be exclusively on The Nasdaq Stock Market (unless the security was dually listed on another U.S. market prior to January 1, 2004 and has continuously maintained such listing). The security types eligible for the Index include common stocks, ordinary shares, ADRs, shares of beneficial interest or limited partnership interests and tracking stocks. Security types not included in the Index are closed-end funds, convertible debentures, exchange traded funds, preferred stocks, rights, warrants, units and other derivative securities.
The Dow Jones Industrial Average® (The Dow®), is a price-weighted measure of 30 U.S. blue-chip companies. The index covers all industries except transportation and utilities.
The Russell 2000® Index measures the performance of the small-cap segment of the US equity universe. The Russell 2000® Index is a subset of the Russell 3000® Index representing approximately 10% of the total market capitalization of that index. It includes approximately 2,000 of the smallest securities based on a combination of their market cap and current index membership. The Russell 2000® is constructed to provide a comprehensive and unbiased small-cap barometer and is completely reconstituted annually to ensure larger stocks do not distort the performance and characteristics of the true small-cap opportunity set.
The MSCI EAFE Index is an equity index which captures large and mid-cap representation across 21 Developed Markets countries*around the world, excluding the US and Canada. With 902 constituents, the index covers approximately 85% of the free float-adjusted market capitalization in each country.
The MSCI Emerging Markets Index captures large and mid-cap representation across 26 Emerging Markets (EM) countries*. With 1,387 constituents, the index covers approximately 85% of the free float-adjusted market capitalization in each country.
Investment-grade Bond (or High-grade Bond) are believed to have a lower risk of default and receive higher ratings by the credit rating agencies. These bonds tend to be issued at lower yields than less creditworthy bonds.
Non-investment-grade debt securities (high-yield/junk bonds) may be subject to greater market fluctuations, risk of default or loss of income and principal than higher-rated securities.
Nasdaq-100® includes 100 of the largest domestic and international non-financial companies listed on the Nasdaq Stock Market based on market capitalization.
The Bloomberg Barclays U.S. Aggregate Bond Index is a broad-based benchmark that measures the investment grade, U.S. dollar-denominated, fixed-rate taxable bond market. This includes Treasuries, government-related and corporate securities, mortgage-backed securities, asset-backed securities and collateralized mortgage-backed securities. ACA-2202-2.
