The Q1 Scorecard
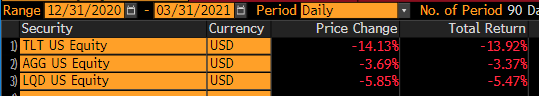
Source: Bloomberg (As of 3/31/21) TLT = iShares 20+ Year Treasury Bond ETF ($12bn AUM); AGG = iShares Core U.S. Aggregate Bond ETF ($87bn AUM); LQD = iShares iBoxx $ Investment Grade Corporate Bond ETF ($41bn AUM). All AUMs are as of 5/12/21.
While overall asset allocation portfolios performed well in the first quarter of 2021, it was the worst quarter to own bonds in over 40 years – the perceived “safe” portion of an investor’s portfolios, fixed income, showed quarterly losses for the first time since the 2013 taper tantrum. Though, April did provide some relief to the upward pressure on interest rates as the Q1 spike was likely overdone. Since 1982 we’ve witnessed the best period ever for the return-risk trade-off of 60:40, as both stocks and bonds delivered strong returns and diversified each other.
Moving forward, we believe that it is imperative investors adapt their investment philosophy, as the historical benefits from including bonds in a portfolio may disappear. We believe that the tailwind of a bond bull market, benefitting portfolios over the last 30+ years looks to be turning the other way. Are your clients prepared?
Corporations are Borrowing at Record Levels
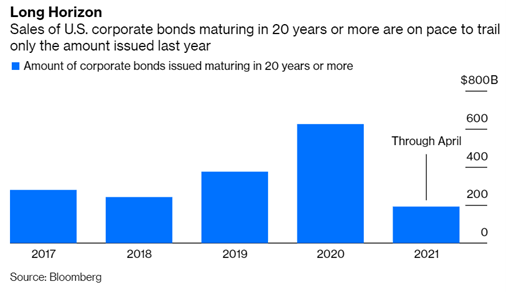
Source: Bloomberg. As of April 30, 2021.
Lately, companies like JPM, GS, BAC, AAPL and AMZN have been raising capital hand over fist. Why are these companies raising capital? Because borrowing costs are too tempting to resist, as companies believe that there are projects to pursue that carry higher returns on capital than the cost of this cheap debt or that inflation will effectively make it cheaper to repay in the future. As corporations are borrowing lights out, will the lenders (bondholders) be stuck holding the bag?
A perfect example of the borrowing frenzy is the announcement of the year’s second largest debt sale where Amazon intends to raise $18.5bn with $7bn of the deal 20-year maturity or longer. As an aside, Amazon currently has about $75bn cash on hand.
Fixed Income – The Problem Child of Portfolio Construction
As advisors are scrambling to ditch bonds and seek alternative solutions for their clients’ portfolios, we felt we’d continue to fuel the fire by showcasing more reasons as to why we believe fixed income is likely to be a drag on portfolios moving into the future.
We’d like to layout four potential headwinds for Fixed Income investments – (1) Longevity Risk and (2) Drawdown Risk
- Bonds Simply Lack Future Return Potential
- Bonds Face Potential Purchasing Power Loss as they Lack Inflation Protection
- Durations are longer and Credit Spreads are lower, Magnifying Downside
- We expect the Long-Term Correlation Benefit Between Bonds and Stocks to break down as rates are Historically Low
Longevity Risk #1 – We Believe that Bonds Lack Future Return Potential
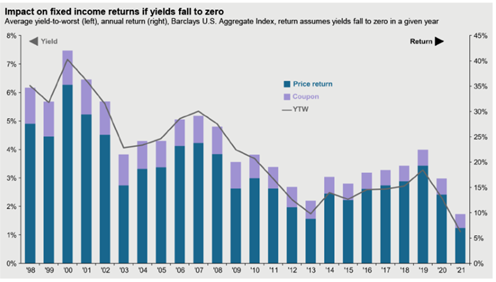
Source: JP Morgan. As of 4/30/2021.
When you dissect how bonds can generate returns moving forward, the inputs are as slim as ever. Bonds can generate returns predominately in three ways:
Coupon (interest income) +/- Yield Curve (Change in Interest Rates/ Shape of Yield Curve) +/- Credit Spreads
Typically, bonds provide the highest returns when interest rates drop with a max gain at the theoretical floor of interest rates at 0%. Remember, bonds and interest rates have an inverse relationship, i.e., when rates drop, bond prices rise, and vice versa. Right now, if rates dropped to 0%, bonds prices, as measured by the Barclays Aggregate, would return the least amount ever.
Simply said, your upside in bonds is the lowest it’s ever been.
With less income to reinvest back as rates rise on top of credit spreads near/at historic tights, we believe the typical cushion of interest income will be less effective in mitigating losses, magnifying drawdowns. This is an asymmetry that we believe is not fully recognized by most advisors.
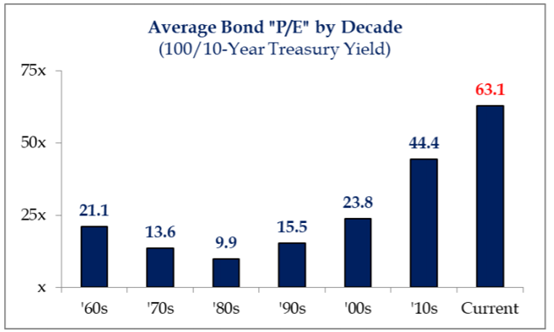
Source: Strategas. As of 5/07/21.
Another way to measure valuations in the fixed income world is take the bond price ($100) and divide it by the 10-Year Treasury Yield to get a “P/E” multiple. The graphic above shows how expensive bonds are compared to history. Keep in mind those bond earnings come with zero potential for growth… and you thought tech was expensive! We view stashing 30-40% of a portfolio into an asset class with such little upside very well could lead to client’s missing necessary returns to meet retirement spending requirements.
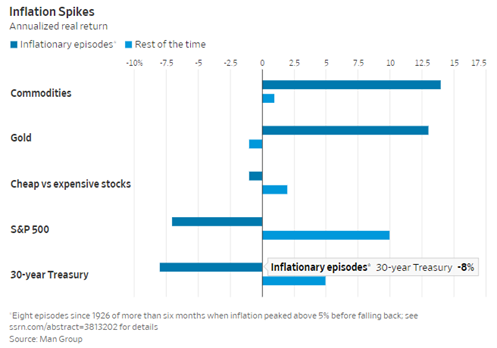
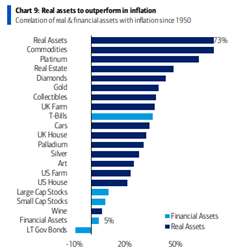
Longevity Risk #2 – Bonds Likely to Underperform during Inflationary Periods
That leads us to our next point – in a potentially inflationary environment, historically, fixed income with extended duration has been the worst asset class to own. During inflationary periods, assets relying on returns in the distant future will be hit the most by rising rates (fears of inflation). These fixed return streams are unable to adjust for the inflation pressures.
Source: Financial Times. As of 5/11/21
Source: Charlie Bilello. As of 5/11/21
Source: Bank of America. . As of 4/30/2021
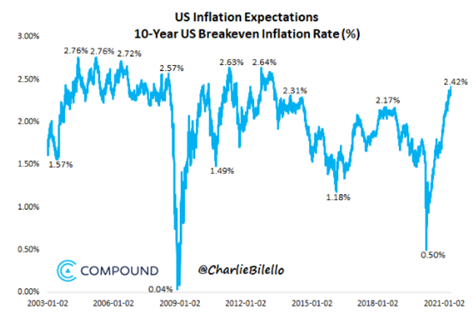
While we haven’t seen what we consider meaningful inflation in years, we did witness some during the 1970s-decade. Inflation averaged a 7% CAGR throughout the decade, doubling the price of goods over a 10-year period. Fast forward to today, the Fed has stated its mandate is for full employment while being okay with some type of “transitory” inflation, i.e., allowing it to run hot in the near term. Though, the market might be saying something different as the 10- Year Breakeven yields are expecting the highest level of inflation since the Great Financial Crisis. While inflation didn’t pan out following the GFC due to numerous reasons, we believe this time COULD be different as substantially more COVID assistance went to Main Street versus Wall Street. While TIPS have historically been a suitable alternative to nominal bonds during inflationary periods, we believe they will be less effective this time.
If you don’t read the full blog post, here’s the summary: 10-year TIPS are paying 0.9% below inflation. Inflation will have to rise by at least that much over the decade just to maintain its purchasing power. If inflation fears pick up, TIPS prices might rise but for investors who hold them to maturity they cap their return at inflation, minus 0.9%. Bottom line is that the loss of purchasing power by holding fixed income earning negative real returns has the potential to create long term return issues for household wealth.
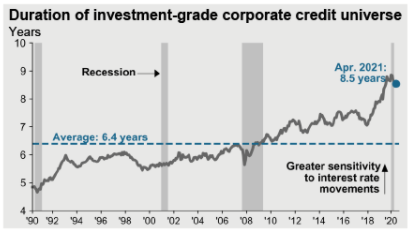
Drawdown Risk #1 – Are Bonds Priced to Perfection, Given Longer Durations and Tighter Credit Spreads?
Source: JP Morgan Asset Management. As of 04/30/2021
With yields trending lower the past 30 years, corporations have been able to extend the length of their debt without drastically increasing the cost to service the debt. This has caused the duration of the investment grade credit index to nearly double. As durations appear extended, the interest rate risk has also nearly doubled. This increases the loss potential in a rising rate environment.
For example, the 30-year Treasury yield hit ~1% at the height of the panic last March and has moved up 135bps to ~2.35% today, but that relatively small rise in rates led to a 20% drop in price, because of the duration.
Interest rate risk is real!
Source: JP Morgan Asset Management. As of 4/30/21
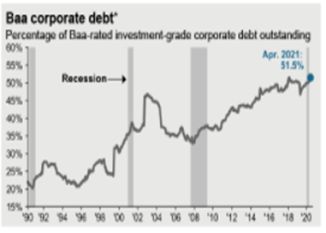
On top of durations extending longer across the investment grade universe, we believe the quality of debt has gotten worst. Over 51% of the investment grade corporate debt outstanding is Baa or lower. This is a new record!
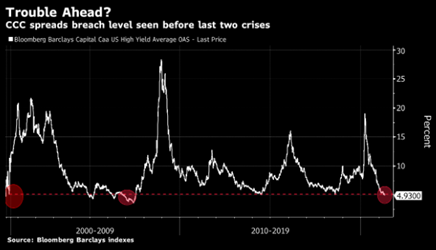
Source: Bloomberg. Date as of 4/27/21
It wouldn’t be a good bond note without pointing out that the riskiest of debt has been the best performer in 2021. High-Yielding Bonds, as measured by the The Barclays Caa US High Yield index, hit its lowest spread (credit compensation for risk) since 2007. Historically when that spread has hit ~5% or tighter it has been a bearish signal as it has been followed by spread widening as the pricing is just too generous considering the quality of borrower.
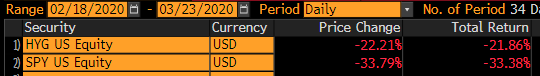
Source: Bloomberg. HYG= iShares iBoxx High Yield Corporate Bond ETF. $21bn AUM. SPY= SPDR S&P 500 ETF. $358bn AUM. All AUM as of 5/12/21
We got a taste of the dangers of high yield during COVID where HYG (iShares iBoxx High Yield Corporate ETF) felt 65% of the SPY downside. From our analysis, the hidden equity-like risk embedded in High Yield exposes clients to not only substantial market downside but also requires a strong economy, doubling down exposures across both equity and fixed income holdings in portfolios.
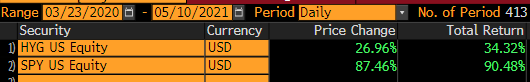
Source: Bloomberg. HYG= iShares iBoxx High Yield Corporate Bond ETF. $21bn AUM. SPY= SPDR S&P 500 ETF. $358bn AUM. All AUM as of 5/12/21.
On the contrary, since the COVID lows on 3/23/2021, HYG only captured 38% of the upside of the SPY… the asymmetry just isn’t there, in our opinion, you might as well just own stocks!
Again, as investors find themselves owning a portfolio of longer duration bonds, as well as less compensation for risk throughout the credit market, we think there is real potential to see their fixed income portfolios significantly decline in value in either a rising rate environment or a repricing of credit risk. This can happen in either a recessionary or stagflationary environment, exacerbating drawdowns!
Drawdown Risk Risk #2 – The Perfect Hedge… Gone Wrong
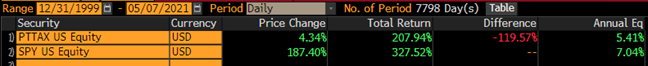
Source: Bloomberg. PTTAX = Pimco Total Return Bond Fund. $67 Billion AUM. SPY= SPDR S&P 500 ETF. $358bn AUM. All AUM as of 5/12/21.
We believe High-Quality bonds have served as a near perfect hedge against stocks over the last 30 years. When stocks dipped, bonds rallied to offset losses and as stocks ripped up, we viewed bonds losses as minimal given their high interest payments and general decline in interest rates. From our perspective, typical Stock/Bond allocation strategies (Modern Portfolio Theory) have worked like a charm. Both assets have provided what we deem as attractive upside while downside has been tolerable, as bonds have acted as a synthetic market put (insurance) during market drawdowns while spitting off an attractive yield. That game changes when interest rates are near zero and the correlation benefits historically accompanying stocks and bonds breaks down.
Stock-Bond Correlation Most Negative Since November 2016
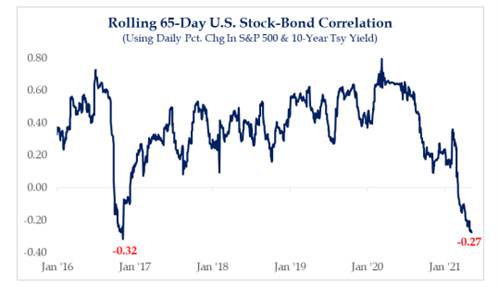
Source: Strategas. As of 5/10/21.
The rolling 65-day correlation between the daily change in the S&P 500 and the U.S. 10-Year Treasury yield has fallen to -0.27, a correlation that has not been seen since November of 2016. This makes hedging stocks with bonds more difficult as bonds are losing principal and stock prices are falling.
If both sides of your portfolio (bonds and stocks) lose money at the same time because correlations breakdown unexpectedly, it opens the pathway to losses higher than client’s risk tolerances can stomach. Loss aversion bias states that clients can stomach the upside substantially more than a like-minded move to the downside. This type of asymmetry can lead to clients making brash, emotional decisions.
Looking Ahead
With money as easy as we’ve seen over the past 20 years following the Fed/ Government’s policy response to COVID-19, we believe we will see more pressure on long term rates to trend upward as the potential for higher inflation to lingers as the economy gets back on its feet.
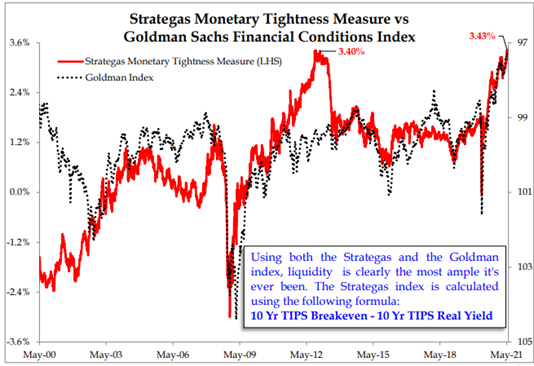
Source: Strategas. As of 5/10/2021
The Strategas Monetary Tightness Measure shows just how ample liquidity current is. While the non-farm payrolls, i.e., the jobs report, last Friday (5/7/21) probably leads to a continuation of loose policy, if there is one caution, it’s the following: the last time the Strategas index was indicating conditions almost this easy was December of 2012, when 10-year yields sat at 1.60%. Within 1 month, 10s had moved to 2%, and within 9 months 10s had moved to 3%.
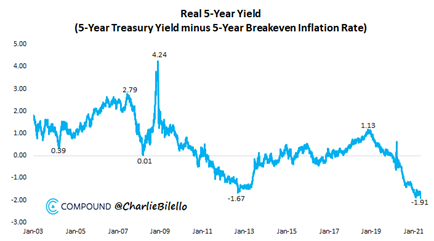
Source: Charlie Bilello. As of 5/11/21.
As we view rates likely rise into the future, it is important to remember that after accounting for inflation bond investors are currently receiving a -1.91% real yield on 5-Year Treasuries, the lowest compensation ever. On top of that credit is priced near perfection.
When capital is in oversupply, investors compete for deals by accepting low returns and a slender margin of error. It reminds us of Howard Marks series, “Lessons From a Crisis”:
“When people want to buy something, their competition takes the form of an auction in which they bid higher and higher. When you think about it, bidding more for something is the same as saying you’ll take less for your money. Thus, the bids for investments can be viewed as a statement of how little return investors demand and how much risk they’re willing to accept.”
This brings us to our closing points, why would investors hold fixed income in their portfolios that simply can’t do what they are intended to do: provide income and buffer equity losses during market drawdowns. While fixed income has been a juggernaut in client portfolios over the last 30+ years, we believe assuming status quo sets up for destruction moving forward.
*https://novelinvestor.com/howard-marks-lessons-crisis/
Disclosures
This page contains information and links to third party sites not affiliated with Aptus Capital Advisors (“ACA”). Past performance is not indicative of future results. This material is not financial advice or an offer to sell any product. The information contained herein should not be considered a recommendation to purchase or sell any particular security. Forward looking statements cannot be guaranteed.
This commentary offers generalized research, not personalized investment advice. It is for informational purposes only and does not constitute a complete description of our investment services or performance. Nothing in this commentary should be interpreted to state or imply that past results are an indication of future investment returns. All investments involve risk and unless otherwise stated, are not guaranteed. Be sure to consult with an investment & tax professional before implementing any investment strategy. Investing involves risk. Principal loss is possible.
Advisory services offered through Aptus Capital Advisors, LLC, a Registered Investment Adviser registered with the Securities and Exchange Commission. Registration does not imply a certain level or skill or training. More information about the advisor, its investment strategies and objectives, is included in the firm’s Form ADV Part 2, which can be obtained, at no charge, by calling (251) 517-7198. Aptus Capital Advisors, LLC is headquartered in Fairhope, Alabama. ACA-2105-8.
