As we navigate through these very uncertain times, we’d like to take a deeper dive into different sectors of the fixed income and credit space. The fixed income markets are enormous and complex with a wide spectrum of products offering unique risk and return profiles. This blog goes through several sectors covering performance and rationale for the massive dislocations we’ve seen (specifically March 6th – March 18th) as well as offer our thoughts moving forward. Seemingly each day we get new information on the Fed’s reactions, which are driving sentiment in markets. We will follow up this post with another targeted to break down several of the Feds actions via the different lending facilities and those implications for the markets.
Quick review
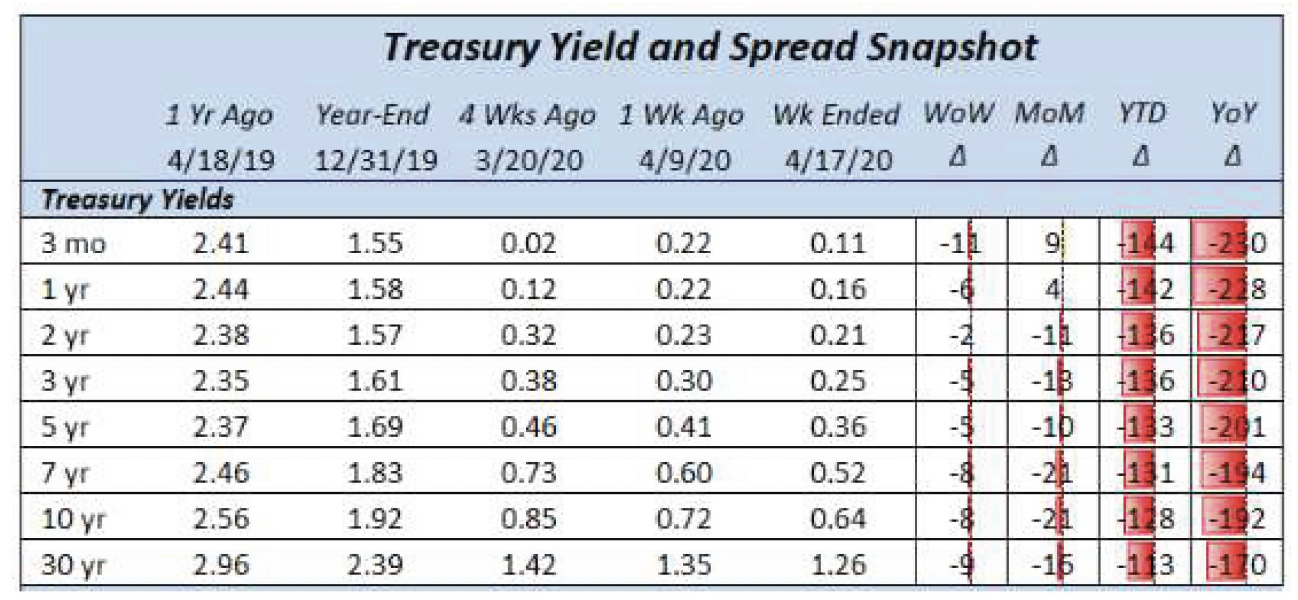
Treasury rates have free fallen lower over the past year, especially in 2020. The fear of the aftershock of the COVID-19 pandemic on the global economy led the Fed to enact two separate emergency rate cuts bringing the Fed Fund rate to 0.00-0.25% in March. The basis point changes of several UST tenors are simply amazing. Throughout the pandemic we have seen a massive flock to safety (and liquidity), cratering yields on U.S. risk free assets up and down the curve.
Source: Vining Sparks IBG, LP
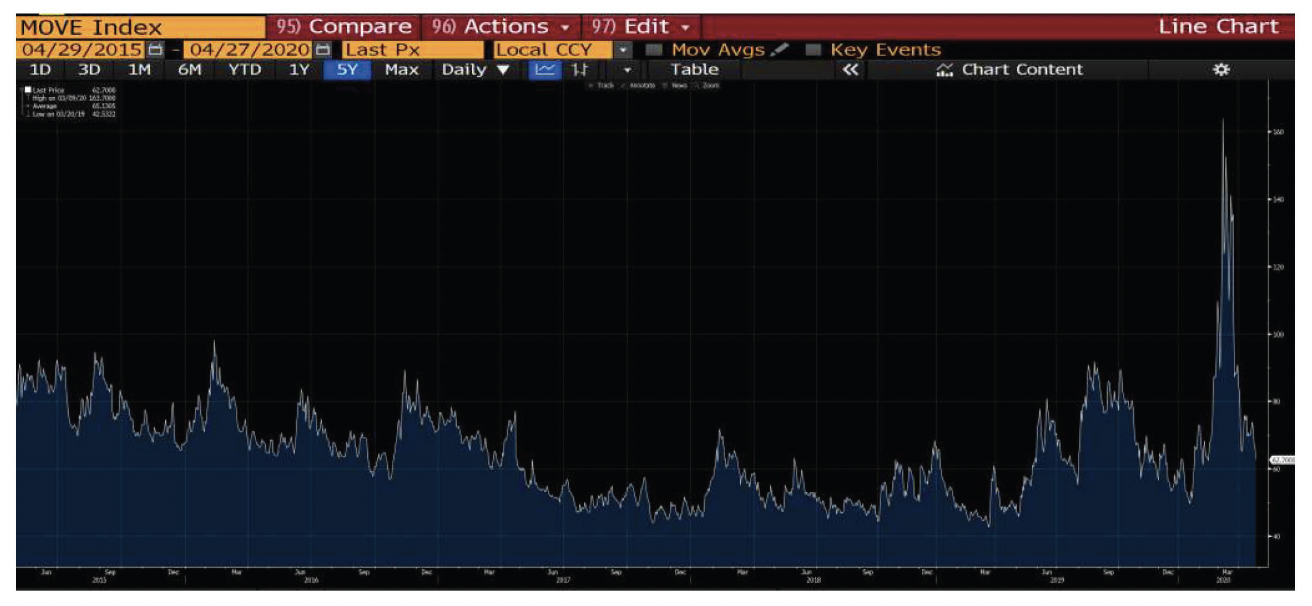
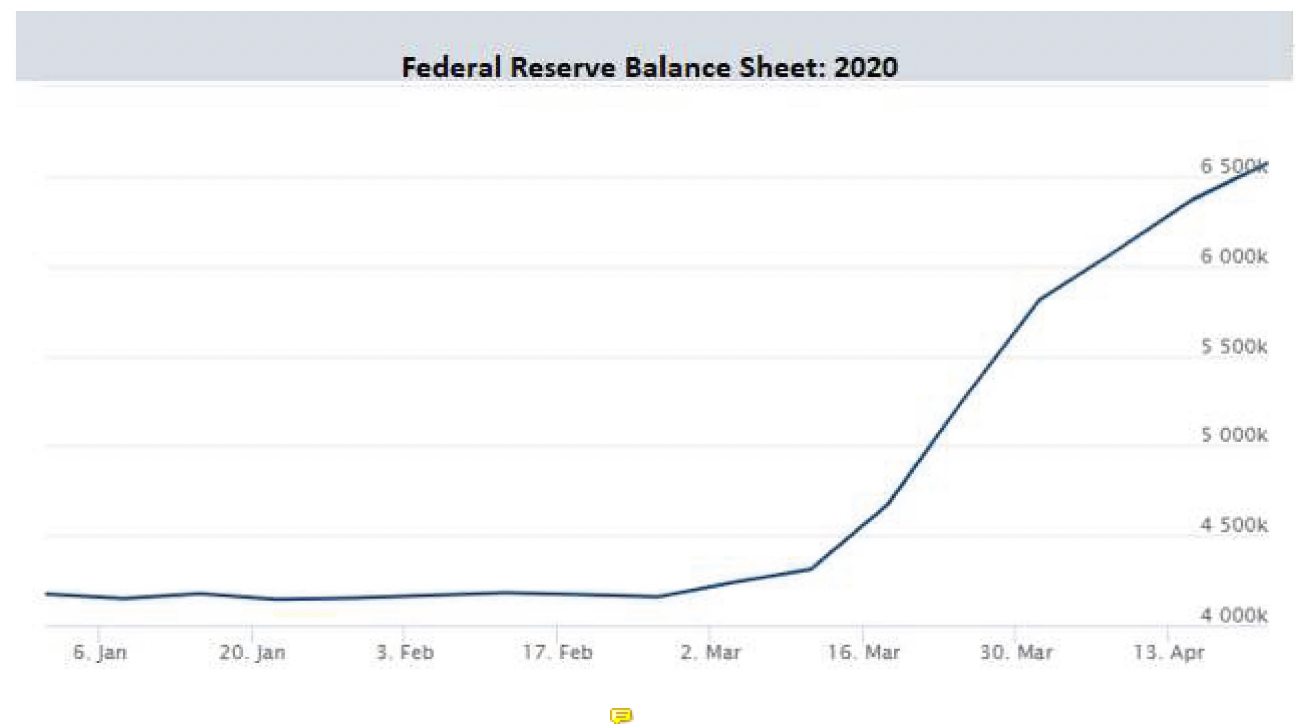
Unprecedented volatility in March across the Fixed Income sector can be seen in the MOVE index. MOVE is essentially the VIX for Treasury Bonds. We had a monumental rise up and then back down as the Fed took action. The Fed action was to the tune of growing their balance sheet by >60% in less than a month (see second chart below).
Source: Bloomberg LP
Source: The Federal Reserve/ Aptus Analytics
Agency/ Treasuries
Source: Trading View
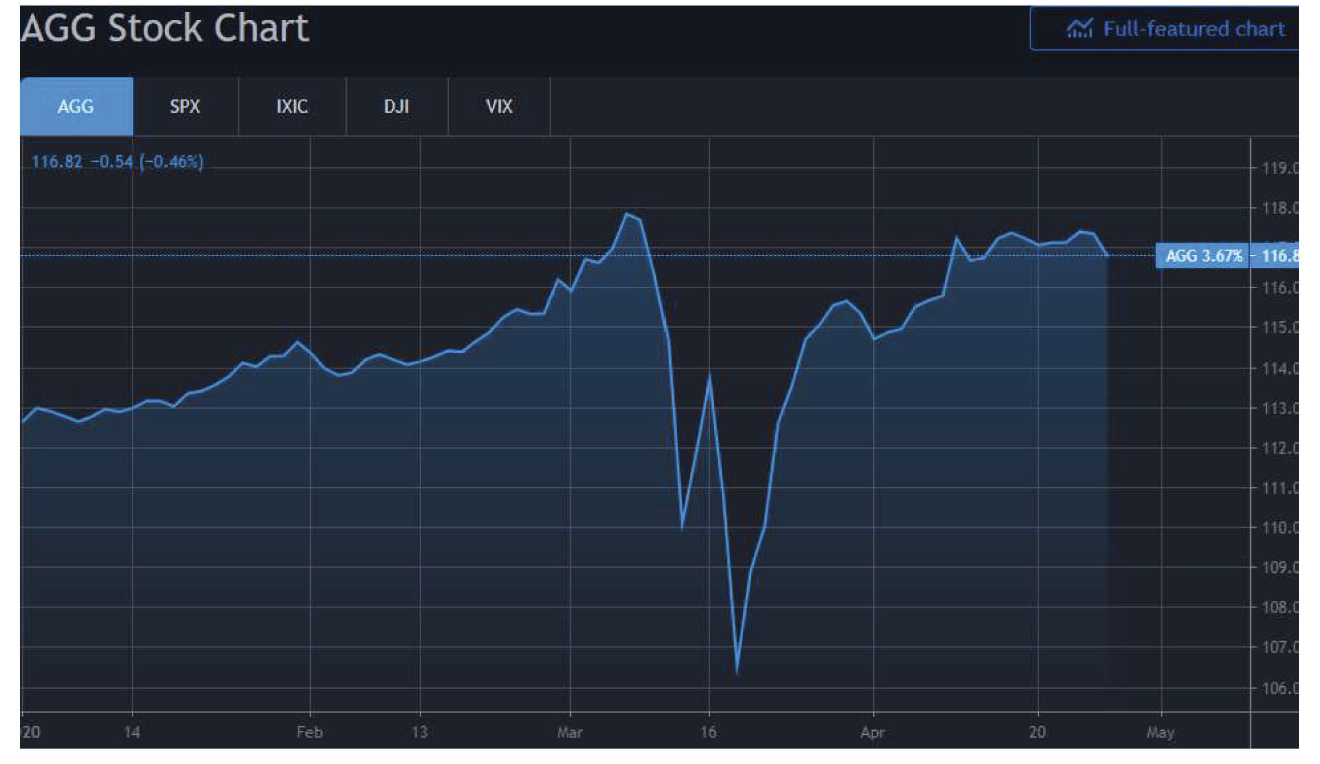
First off, we will start with the Barclays Aggregate (Ticker: AGG). The AGG’s portfolio is allocated ~70% to government back securities (U.S. Treasuries, Agencies, Mortgages) and 30% investment grade corporate securities. This is one of the most benchmarked ETFs and nearly every portfolio has some sort of exposure. The eye opener here is the 9-business day performance of the AGG between March 6th and March 18th where the AGG dropped nearly –10%. Only a few times in history have we seen the AGG drop this aggressively and this is by far the quickest drop of such magnitude.
The cause of the drop was essentially a massive liquidity crunch where the general market saw exponentially more sellers than buyers. The fact that there were no buyers simply means no bids and in turn no liquidity. This leads to wider spreads and lower prices until someone is willing to step in and offer liquidity. The fuel to the fire was margins calls from levered funds which caused a massive need for liquidity, forcing holders to sell at any price. Many times these safe haven assets are the first to get sold as they have incurred the least damage. The “V” shaped recovery seen since March 18th can mostly be attributed to the Fed’s buying programs.
Investment Grade Corporates
Source: Trading View
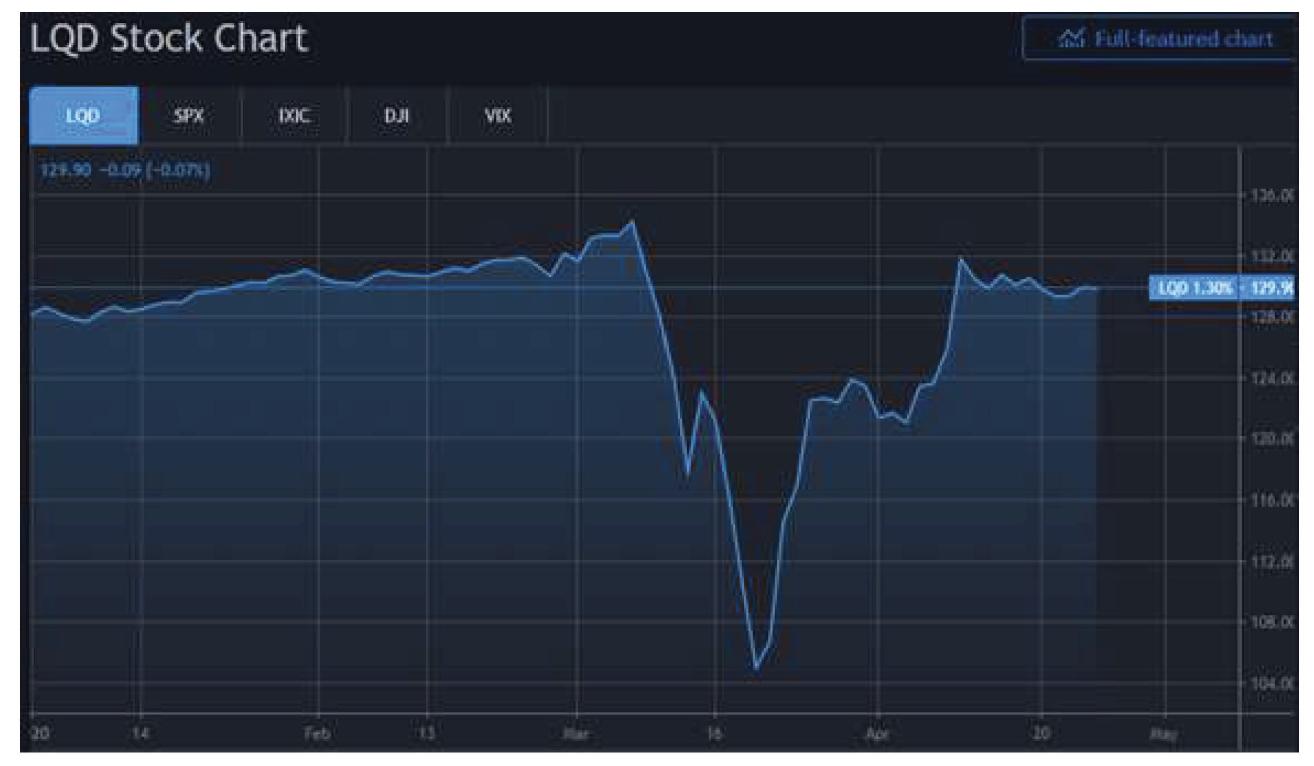
One can imagine the fate of Investment grade bonds (Ticker: LQD) after seeing the melt down of the AGG mentioned above. Nearly a -22% decline in market price from March 6th– March 18th. Again, one of fastest drops in price we have ever seen as investors feared massive impairments on companies’ financial situations (and likely to come downgrades) as a result of the pandemic. Fear and the need for liquidity created an environment where no one wanted to be stuck holding the bag!
Source: Deutsche Bank
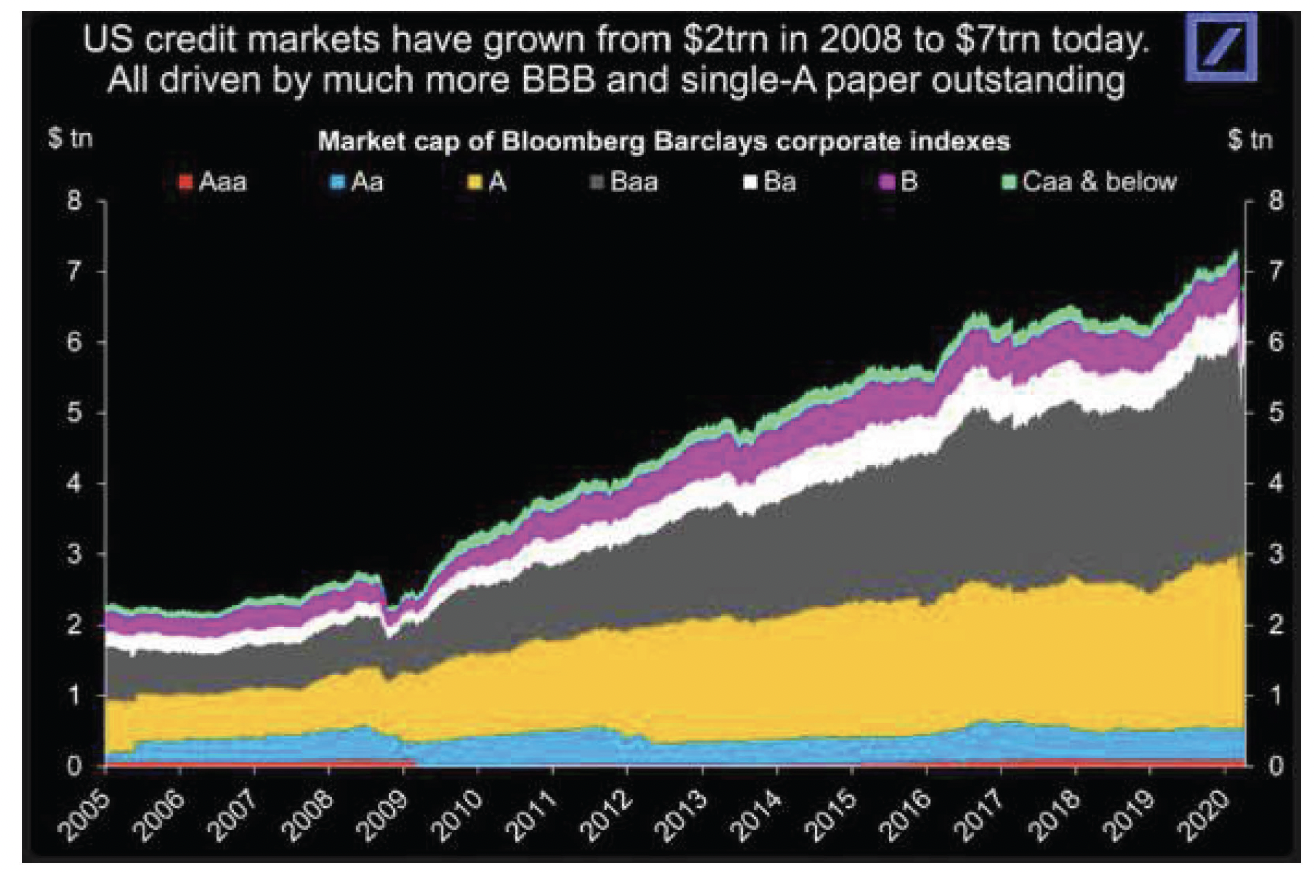
An increase in lower quality issuers (increase in BBB/ Baa rated debt) since the housing crisis has driven growth of the investment grade market. As ratings get closer to junk, the universe of potential holders get lower and lower. We expect more forced selling as issuers are downgraded and typical large institutional holders like pension funds, insurance funds and other regulated entities not only won’t be able purchase but in some mandated instances will be forced to sell. It will be interesting to see how quick the rating agencies will re-rating companies’ debt given their ability to repay could be impaired considering the pandemic.
High Yield
Source: Trading View
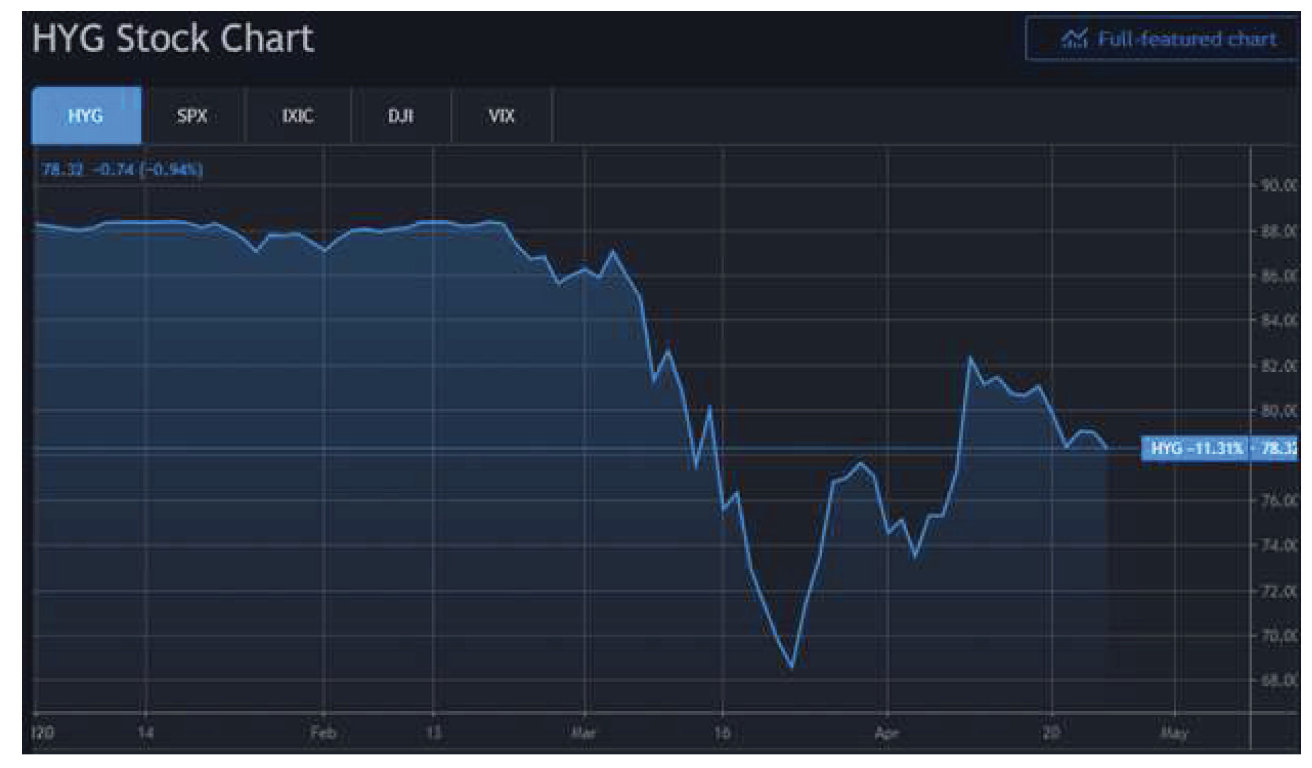
High Yield bonds (Ticker: HYG) also faced a difficult environment with a collapse in the prices of junk bonds as both the stock market and oil prices collapsed. As fear surmounted in the stock market, higher beta debt (less credit worthy borrowers) became even riskier as high uncertainty of business sustainability quickly became a reality. Needless to say, holders of the junk rated debt manically sold at whatever price they could.
Source: Factset
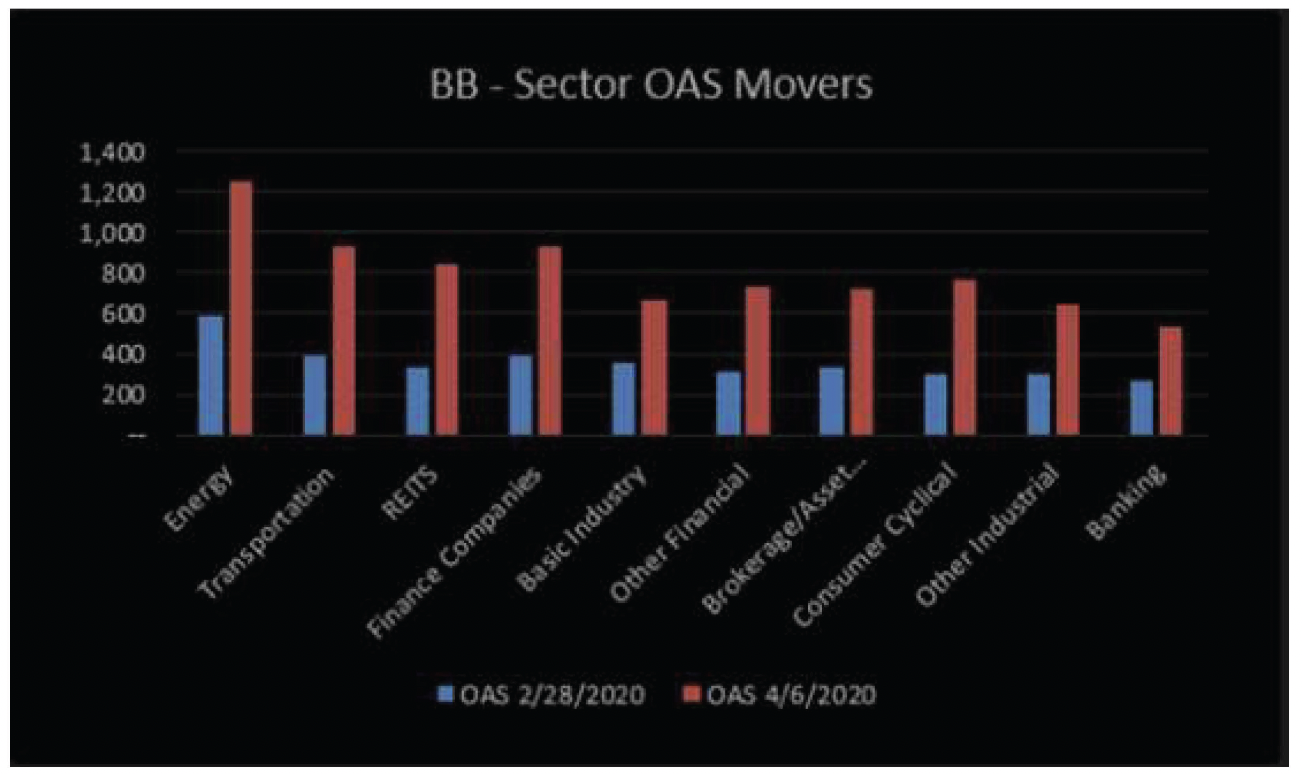
All sectors within the High Yield space have seen spreads widen significantly with energy spreads unsurprisingly being the worst performers. Nearly all sectors saw spread to Treasuries double. We believe the big question here is to whether the underlying borrowers will be able to service their debts given the current business environment, specifically energy companies with significant leverage and falling oil prices.
Emerging Market Debt
Source: Trading View
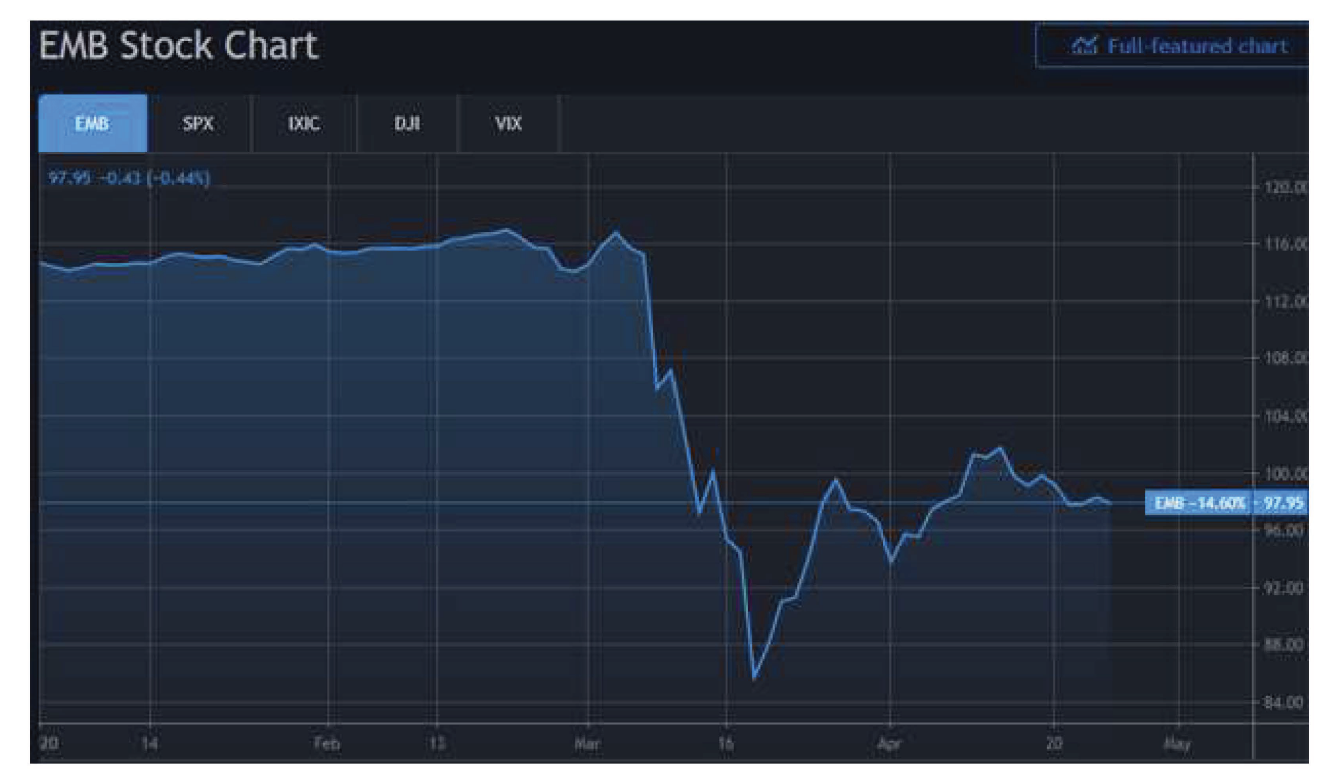
Emerging Market debt (Ticker: EMB) was one of the better performing fixed income classes in 2019. It has gotten smoked through the pandemic. With most EM markets reliant on energy and functioning supply chains it comes to no surprise on the poor performance. The strong $USD continues to devastate these economies from a trade and local currency perspective. We see multiple major headwinds on EM economies through this difficult time.
Municipal Bonds
Source: Trading View
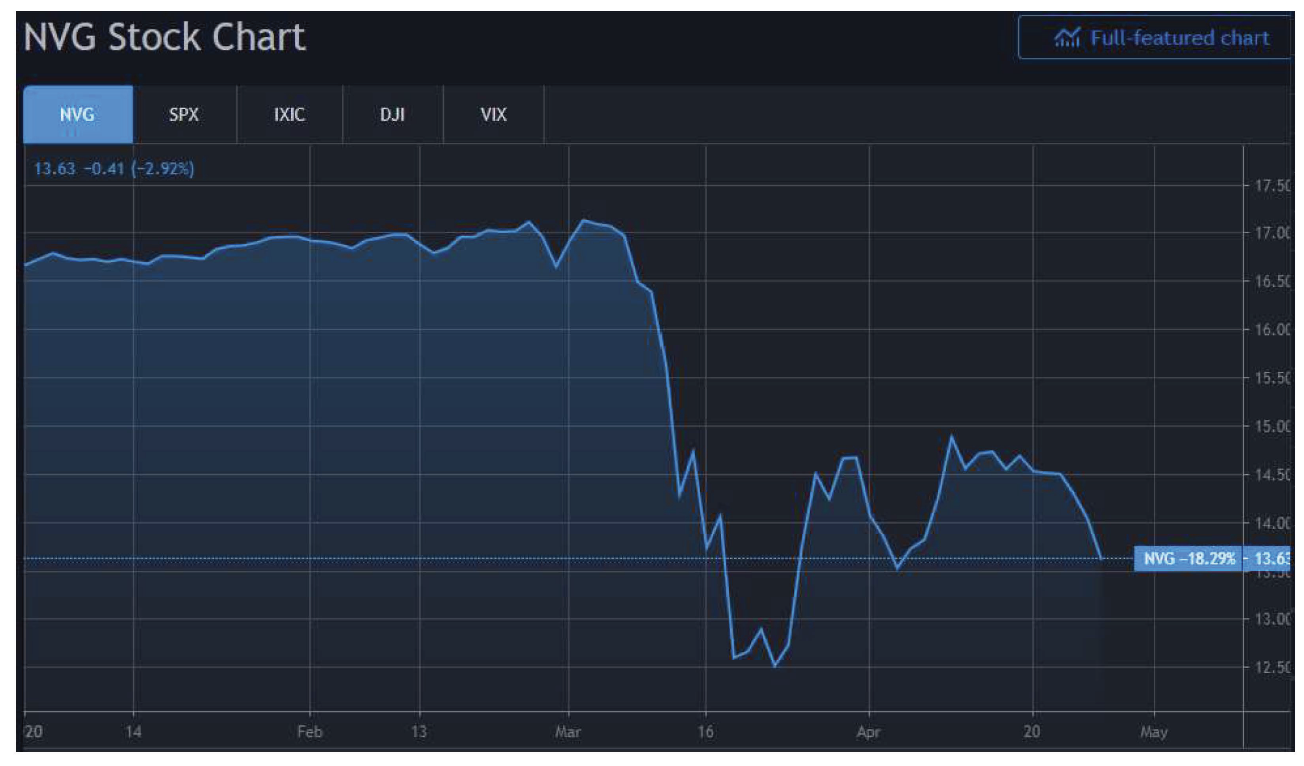
Municipal bond prices historically have shown a very low correlation to equity prices. Unfortunately, in a fire sale, no asset classes are safe. As investors rushed to cash we saw significant pressure on munis throughout March. Highlighted above is Nuveen’s levered municipal closed end fund (ticker: NVG) which saw enormous headwinds from both margin calls internally as well as investors dumping the fund seeking cash (NVG was down -26% from March 6- March 18). The fund is down -18% YTD.
We believe municipalities will require more government intervention to fare the aftermath of the Covid pandemic given the sure reduction in taxes this year. The other consideration is that municipalities and states actually have to have a balanced budget and can’t print money like the Treasury/ Fed combo. The Fed has come in and offered some support to the municipal market helping support prices. We have seen a small recovery in prices and substantially less rampant price dislocations however leveraged funds like NVG are still licking their wounds.
Source: Trading View
Agency Mortgages
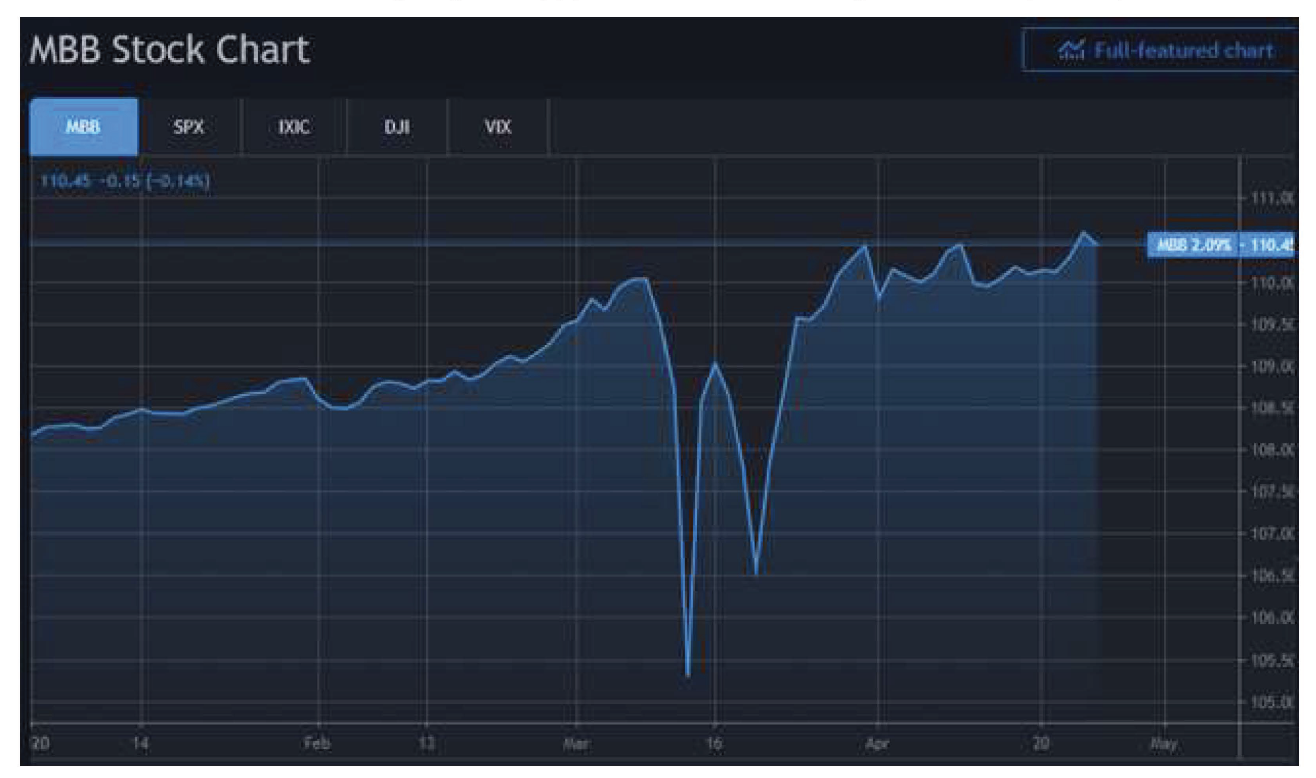
The most supported asset classes by the Fed behind U.S. Treasuries has been mortgages (Ticker: MBB). It is hard for us to wrap our heads around owning mortgages right now given the current economic backdrop. In our opinion we could see a double whammy on mortgage products: refi risk given current interest rates (AKA prepayment risk) and risk of borrower default leading to a loss of premium paid for the security. As mortgage prices have risen materially from lower interest rates and tighter spreads (thanks to the Fed), nearly every purchase regardless of the coupon will come at a premium dollar price. If a borrower refinances or sells their home, the loan pays off at $100 to the bond holder (remember no pre-pay penalty to refinance a mortgage). If the borrower defaults, the loan is still paid off at $100 thanks to the Fannie Mae / Freddie Macs guarantee. I’ll let you guess who guarantees Fannie and Freddie’s balance sheet. As these bonds are priced at hefty premiums, we see significant risk in the above factors while very little upside at present. Negative convexity at its finest!
Levered Loan/Credit
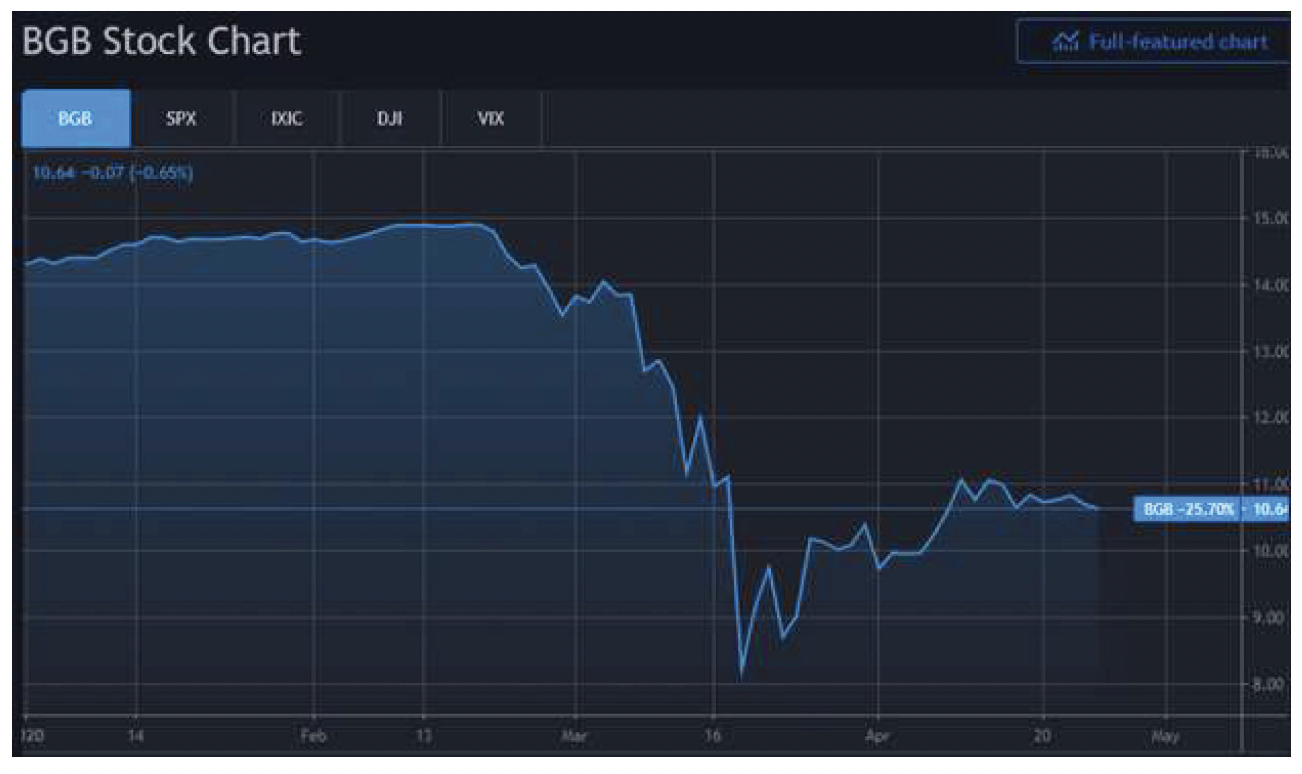
To wrap everything up I wanted to spend a little time going over one of the more leveraged and risky credit products in the market. I will highlight Blackstone’s Strategic Credit Fund (Ticker BGB).
Source: Trading View
Per the prospectus, the fund primarily invests in the loans and other fixed income instruments including first- and second-lien secured loans and high-yield corporate bonds of different maturities. There are two parts to the story here but the real kicker here… leverage! The fund incurs leverage of ~33% of its managed assets by borrowing via a credit facility. This type of fund (along with other leveraged vehicles) utilizes the reverse repo markets where they pledge the securities they own as collateral to secure short-term financing. This works well until liquidity vanishes and the value of the collateral falls off a cliff leading to a margin call. If the fund doesn’t have the cash, it must raise cash… this leads to selling at the bottom and realizing massive losses. The other significant factor here was the redemptions coming from a client dash to cash. This rings true for any leveraged vehicle but especially something involving less liquid, lower rated securities. What we saw here was a straight up fire sale.
Wrapping all this up, one can easily see the Fed’s actions have helped bring some equilibrium back to parts of the fixed income markets. Like one would expect, the risker, leveraged classes were the most volatile through the initial COVID-19 phase. We’ve always said, when a product yields is 5-7% in a <1% 10 year Treasury environment, there is typically risk involved.
We will have a follow up this post to cover some of the specific actions taken by the Fed coming soon!
Past performance is not indicative of future results. This material is not financial advice or an offer to sell any product. The information contained herein should not be considered a recommendation to purchase or sell any particular security. Forward looking statements cannot be guaranteed.
This commentary offers generalized research, not personalized investment advice. It is for informational purposes only and does not constitute a complete description of our investment services or performance. Nothing in this commentary should be interpreted to state or imply that past results are an indication of future investment returns. All investments involve risk and unless otherwise stated, are not guaranteed. Be sure to consult with an investment & tax professional before implementing any investment strategy. Investing involves risk. Principal loss is possible.
Advisory services offered through Aptus Capital Advisors, LLC, a Registered Investment Adviser registered with the Securities and Exchange Commission. Registration does not imply a certain level or skill or training. More information about the advisor, its investment strategies and objectives, is included in the firm’s Form ADV Part 2, which can be obtained, at no charge, by calling (251) 517-7198. Aptus Capital Advisors, LLC is headquartered in Fairhope, Alabama. ACA-20-108.


