Developments over the Past Month
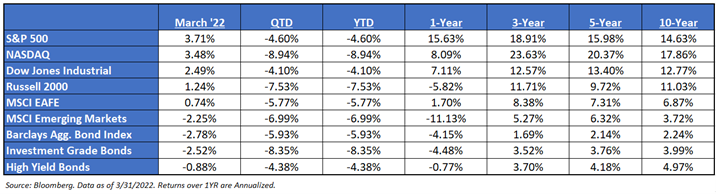
- Monthly Recap: March was a tale of two different periods (see below). The first quarter was one of the worst on record for the collective performance of stocks and bonds, with the latter worse than the former. This makes sense given investor concern focused more on the “Fire” (inflation and the Fed) than the “Ice” (growth slowdown).
- Late March: This Rebound Has Not Been Normal – Heading into the end of the month, the S&P has produced one of its sharpest rallies in history, larger than the biggest 10-day rallies in 7 of the S&P’s 11 bear markets since 1927. It has done so despite clearly weaker fundamentals (more hikes, higher inflation, and curve inversion) and the Fed leaning against equity market strength to hike faster (akin to the Fed writing a call on the market). Rates markets are reflecting this gloomier picture and short “Fed call”, in the largest divergence between equities and rates in the pricing of risk since the GFC.
- Early March – Corrections are Normal: The current correction in stocks earlier this month was overdue. Investors have not had a 10%+ S&P 500 correction since the quick bear market of March 2020. A 10%+ correction has occurred once per year on average since 1930, and have lasted on average 54 trading days before lifting more than 10% from the trough. Bear markets of 20%+ or more occur once every 3-4 years, but 9 of the last 12 since the 1950s have occurred around economic recessions.
- What Drove This Month’s Performance: The S&P 500 outperformed small caps this month. At the end of the month, investors saw a substantial rally in growth broadly in the last two weeks, and it is still unclear if this is just a reversion to the mean after severe value outperformance YTD, fear amongst investors that a recession is getting closer, and thus a move from cyclicals/value and into growth, a growing chorus of stimulus around the world in reaction to commodity price rises in the last month, or perhaps Chinese government comments around supporting the economy has created rolling short squeezes/risk-on breeze across the globe. Probably some combination of all these is the cause.
- America Always Exports Recessions, It Never Imports Them: While tensions between Russia and Ukraine have been rising for years, the current military action is creating concerns about the potential impact on financial markets and the global economy. Fortunately, however, history shows that while geopolitical crises such as the one between Russia and Ukraine can temporarily roil markets, they don’t typically have long-term consequences for investors- look at March’s end of month rally. In general, these types of crises tend to only have a significant and lasting impact on global financial markets if they have a sustained macroeconomic impact on major economies. While Russia’s economy ranks as the world’s 11th largest, according to the IMF, at only 1/20th the size of the US and 1/15th the size of China, it is likely not big enough by itself to affect global markets or economic growth, even if it were to suffer significant economic damage as a result of sanctions or other measures taken against it by the US and Europe.
- Bonds Not Hedging Stocks – We believe that fixed income has offered no hedge to the equity drawdown this year – in fact, the S&P 500 has outperformed during the volatile environment. This was the first ever market correction in the QE regime where bond yields have gone up, not down. There’s been 6 major drawdowns over the last 13 years, in every one of them, yields have roughly declined by 100bps on average during the drawdown – that has not been the case this time.
- Rate Hikes: Market participants are pricing in the potential for as many as eight rate hikes by the Federal reserve this year, with the first hike occurring this past month. Furthermore, the market continues to price in what would be the first-rate hike above 25bps since May 2000. We continue to think that the hawkish estimates will prove to be overblown. The current Federal Reserve has been both hyper transparent, and steadfastly deliberate in their actions. The potential for them to do anything that surprises the markets seems unlikely.
- Yield Curve Flattening & What It’s Telling Investors: The yield curve’s flattening is a sign of growing concern that the Fed is going to hike too much and break something. The curve inverted this past month, which would signal the market believes things are already breaking. As the short end of the curve rises, so too do the odds of rate hikes. The market has seven (8) rate hikes priced in by the end of 2022.
- Earnings: 2021 S&P 500 operating earnings = $209. 2022 = $228 (up from $225 in Mar. 2022). 2023 = $234. 2020 = $142. 2019 = $165.
- Valuations: S&P 500 Fwd. P/E is at 20.1x. EAFE is 14.0x forward P/E, while EM is at 12.4x. R1V is 15.9x v. R1G at 27.7x.
Talking Points Ahead
- Yield Curve: The yield curve officially inverted at the end of March. an inversion of the 10/2 spread does not mean a recession is imminent. Historically speaking, stocks rally for about a year after a 10s-2s inversion, with an average return around 15% (heads up, this is a different range than shown in a below chart). So, a curve inversion is not a reason to sell—it’s a signal that the time on the bull market and economic expansion is now limited, and to prepare for both to end.
- Build Back Better: Though it wasn’t passed in 2021, President Biden outlined the biggest expansion of the federal government matched with the largest tax increase since 1968. Biden senses the post-COVID era is a once-in-a-generation opportunity to massively restructure US fiscal, monetary, and social policy. In our opinion, this is a big experiment. We’ll wait to see how the Build Back Better plan and taxes pan out. It appears that this dramatic change in societal direction has proved to be difficult for some moderate Democrats to get on board, i.e., Manchin.
- We feel it will be worth watching the general trend of economic and fundamental data, and when it will begin to decelerate.
- Longer-term, we believe valuations and bond yields will eventually matter, and both will lower expected returns for balanced portfolios.
Disclosures:
Aptus Capital Advisors, LLC is a Registered Investment Advisor (RIA) registered with the Securities and Exchange Commission and is headquartered in Fairhope, Alabama. Registration does not imply a certain level of skill or training. For more information about our firm, or to receive a copy of our disclosure Form ADV and Privacy Policy call (251) 517-7198 or contact us here. Information presented on this site is for educational purposes only and does not intend to make an offer or solicitation for the sale or purchase of any securities.
This commentary offers generalized research, not personalized investment advice. It is for informational purposes only and does not constitute a complete description of our investment services or performance. Nothing in this commentary should be interpreted to state or imply that past results are an indication of future investment returns. All investments involve risk and unless otherwise stated, are not guaranteed. Be sure to consult with an investment & tax professional before implementing any investment strategy.
Past performance is not indicative of future results. This material is not financial advice or an offer to sell any product. The information contained herein should not be considered a recommendation to purchase or sell any particular security. Forward looking statements cannot be guaranteed.
The S&P 500® is widely regarded as the best single gauge of large-cap U.S. equities. There is over USD 11.2 trillion indexed or benchmarked to the index, with indexed assets comprising approximately USD 4.6 trillion of this total. The index includes 500 leading companies and covers approximately 80% of available market capitalization.
The Nasdaq Composite Index measures all Nasdaq domestic and international based common type stocks listed on The Nasdaq Stock Market. To be eligible for inclusion in the Index, the security’s U.S. listing must be exclusively on The Nasdaq Stock Market (unless the security was dually listed on another U.S. market prior to January 1, 2004 and has continuously maintained such listing). The security types eligible for the Index include common stocks, ordinary shares, ADRs, shares of beneficial interest or limited partnership interests and tracking stocks. Security types not included in the Index are closed-end funds, convertible debentures, exchange traded funds, preferred stocks, rights, warrants, units and other derivative securities.
The Dow Jones Industrial Average® (The Dow®), is a price-weighted measure of 30 U.S. blue-chip companies. The index covers all industries except transportation and utilities.
The Russell 2000® Index measures the performance of the small-cap segment of the US equity universe. The Russell 2000® Index is a subset of the Russell 3000® Index representing approximately 10% of the total market capitalization of that index. It includes approximately 2,000 of the smallest securities based on a combination of their market cap and current index membership. The Russell 2000® is constructed to provide a comprehensive and unbiased small-cap barometer and is completely reconstituted annually to ensure larger stocks do not distort the performance and characteristics of the true small-cap opportunity set.
The MSCI EAFE Index is an equity index which captures large and mid-cap representation across 21 Developed Markets countries*around the world, excluding the US and Canada. With 902 constituents, the index covers approximately 85% of the free float-adjusted market capitalization in each country.
The MSCI Emerging Markets Index captures large and mid-cap representation across 26 Emerging Markets (EM) countries*. With 1,387 constituents, the index covers approximately 85% of the free float-adjusted market capitalization in each country.
Investment-grade Bond (or High-grade Bond) are believed to have a lower risk of default and receive higher ratings by the credit rating agencies. These bonds tend to be issued at lower yields than less creditworthy bonds.
Non-investment-grade debt securities (high-yield/junk bonds) may be subject to greater market fluctuations, risk of default or loss of income and principal than higher-rated securities.
The Bloomberg Barclays U.S. Aggregate Bond Index is a broad-based benchmark that measures the investment grade, U.S. dollar-denominated, fixed-rate taxable bond market. This includes Treasuries, government-related and corporate securities, mortgage-backed securities, asset-backed securities and collateralized mortgage-backed securities. ACA-2204-2.
