March ‘23 Market Recap; The S&P 500 ignored the fallout from banking woes and recorded a surprising +3.7% gain last month, leaving the index in positive territory for Q1 ‘23 (+7.5%). After a mid-month hike, the current Fed Funds rate (upper bound) is at 5% vs. 2-Year Treasuries at 4% – one of these assessments is wrong. Fed either needs to cut/pivot, or Treasury yields need to go higher. Equities seem to be trading in the former (pivot) camp. Investors now find themselves in a waiting game for evidence of a) recession showing up, b) inflation cooling off, and c) assessing how the events surrounding the mini-banking crisis have impacted corporate/consumer
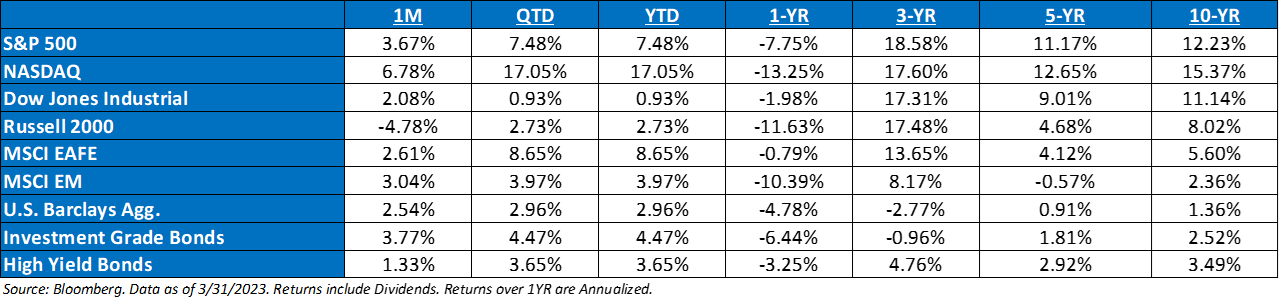
What Drove Markets in Q1 ’23?: The S&P 500 logged solid gains in March and in the first quarter 2023, as investors focused on hope for an economic soft landing and, yet again, ignored what the Fed is saying and priced in dovish future monetary policy. To that point, the market is so focused on potential rate cuts that stocks ended the month higher than when they started, despite the worst banking crisis since the GFC. This speaks to the strength of dovish policy expectations. Every single rally in stocks since this bear market began has been driven by the hope from markets that a Fed pivot or pause is imminent, and it was that way again over the past month.
Bond Market Update: Interest rate volatility has continued to be significant in Q1. Bond markets have responded violently to economic data and Fed speak throughout the year, where each month of Q1 has sported a different narrative and in turn wildly different future outcomes. The yield curve increasingly inverted into early March but following the systemic pressures has bull steepened, as participants expect notable interest rate cuts in the near future to combat a softening economy and lower expected future inflation. Credit markets have remained well contained, though spreads have widened, still well below “recessionary” levels.
Hard or Soft Landing?: Cutting through the noise, we started 2023 with this major question: Hard landing or soft landing? Since the start of the year, the Fed has hiked rates 50 basis points, and if they don’t keep hiking, it’ll be because the banking system is so stressed that they can’t. A regional banking crisis or a pivot does not make a soft landing more likely. That said, the resilient nature of the market must be respected, and clearly there have been real positives over the past three months as earnings have been better than feared, as has economic growth.
Market Return Seasonality: Looking at forward returns for the 34 times the S&P gained more than 5% in 1Q since 1928…the following quarters showed positive returns more than 61% of the time but with more modest gains. 2Q and 3Q showed average returns of 1.8% and 0.4%, respectively, with median returns of 2.4% and 3.2%. 4Q returns showed improvement but did not match 1Q results. Annual returns averaged 17%, with a median of 19% and a positivity rate of 88%.
The Fed Update: The Fed raised their Federal Funds rate by 500 bps in one year. The surprise up until the last couple weeks has been the minimal impact the tightening cycle has had on both the real and financial economy. It does appear the banking sector has finally begun to feel the pain of the hikes and inverted yield curve. We believe that continued stickier inflation could pin the Fed between a proverbial “rock and a hard place”, as policy makers would face the decision of either continuing the fight against stickier-than-expected inflation with aggressive policy, or risk sending the global financial system into another crisis as collateral damage increases.
What Concerns Us the Most?: In short: 1) Continued volatility and contagion in banking sector; 2) Inflation transitions to growth frustration; 3) The potential for a Fed policy error and continued collateral damage; 4) A general tendency to think about the economy and stock prices in V-shaped terms, i.e., a Fed Pivot saving the day.
S&P Valuation: The S&P 500 valuation increased over the month, as the market rallied off of an expected Fed pivot. Forward earnings expectations stayed neutral, even amidst a potential mini-banking crisis.
Earnings: ‘22 S&P 500 op. earnings = $219 (+7.4%). 2023 = $222 (+1.8%). 2021 = $204. 2020 = $136. 2019 = $161. *
Valuations: S&P 500 Fwd. P/E: 18.5x, EAFE: 13.7x, EM: 12.2x, R1V: 16.0x, R1G: 26.8x, and R2K: 15.1x.*
*Source: Bloomberg and FactSet, Data as of 3/31/23
Disclosures
Aptus Capital Advisors, LLC is a Registered Investment Advisor (RIA) registered with the Securities and Exchange Commission and is headquartered in Fairhope, Alabama. Registration does not imply a certain level of skill or training. For more information about our firm, or to receive a copy of our disclosure Form ADV and Privacy Policy call (251) 517-7198 or contact us here. Information presented on this site is for educational purposes only and does not intend to make an offer or solicitation for the sale or purchase of any securities.
This commentary offers generalized research, not personalized investment advice. It is for informational purposes only and does not constitute a complete description of our investment services or performance. Nothing in this commentary should be interpreted to state or imply that past results are an indication of future investment returns. All investments involve risk and unless otherwise stated, are not guaranteed. Be sure to consult with an investment & tax professional before implementing any investment strategy.
Past performance is not indicative of future results. This material is not financial advice or an offer to sell any product. The information contained herein should not be considered a recommendation to purchase or sell any particular security. Forward looking statements cannot be guaranteed.
The S&P 500® is widely regarded as the best single gauge of large-cap U.S. equities. There is over USD 11.2 trillion indexed or benchmarked to the index, with indexed assets comprising approximately USD 4.6 trillion of this total. The index includes 500 leading companies and covers approximately 80% of available market capitalization.
The Nasdaq Composite Index measures all Nasdaq domestic and international based common type stocks listed on The Nasdaq Stock Market. To be eligible for inclusion in the Index, the security’s U.S. listing must be exclusively on The Nasdaq Stock Market (unless the security was dually listed on another U.S. market prior to January 1, 2004 and has continuously maintained such listing). The security types eligible for the Index include common stocks, ordinary shares, ADRs, shares of beneficial interest or limited partnership interests and tracking stocks. Security types not included in the Index are closed-end funds, convertible debentures, exchange traded funds, preferred stocks, rights, warrants, units and other derivative securities.
The Dow Jones Industrial Average® (The Dow®), is a price-weighted measure of 30 U.S. blue-chip companies. The index covers all industries except transportation and utilities.
The Russell 2000® Index measures the performance of the small-cap segment of the US equity universe. The Russell 2000® Index is a subset of the Russell 3000® Index representing approximately 10% of the total market capitalization of that index. It includes approximately 2,000 of the smallest securities based on a combination of their market cap and current index membership. The Russell 2000® is constructed to provide a comprehensive and unbiased small-cap barometer and is completely reconstituted annually to ensure larger stocks do not distort the performance and characteristics of the true small-cap opportunity set.
The MSCI EAFE Index is an equity index which captures large and mid-cap representation across 21 Developed Markets countries*around the world, excluding the US and Canada. With 902 constituents, the index covers approximately 85% of the free float-adjusted market capitalization in each country.
The MSCI Emerging Markets Index captures large and mid-cap representation across 26 Emerging Markets (EM) countries*. With 1,387 constituents, the index covers approximately 85% of the free float-adjusted market capitalization in each country.
Investment-grade Bond (or High-grade Bond) are believed to have a lower risk of default and receive higher ratings by the credit rating agencies. These bonds tend to be issued at lower yields than less creditworthy bonds.
Non-investment-grade debt securities (high-yield/junk bonds) may be subject to greater market fluctuations, risk of default or loss of income and principal than higher-rated securities.
Nasdaq-100® includes 100 of the largest domestic and international non-financial companies listed on the Nasdaq Stock Market based on market capitalization.
The Bloomberg Barclays U.S. Aggregate Bond Index is a broad-based benchmark that measures the investment grade, U.S. dollar-denominated, fixed-rate taxable bond market. This includes Treasuries, government-related and corporate securities, mortgage-backed securities, asset-backed securities, and collateralized mortgage-backed securities. ACA-2304-1.
