Developments Over the Past Month
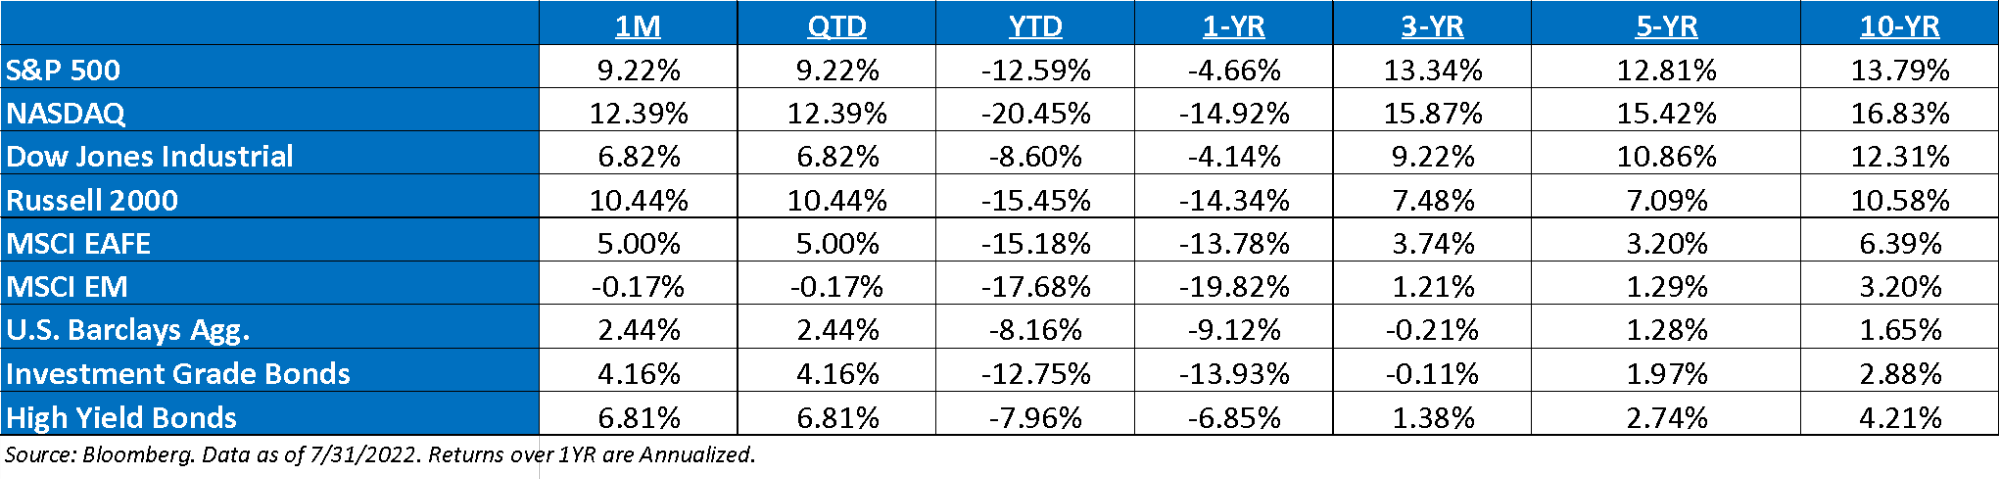
July 2022 Market Recap: The month of July was driven by better-than-feared earnings, economic data, and falling inflation expectations. The market spent most of June pricing in an earnings Armageddon that has yet to come to fruition. The market took the most recent Fed meeting as a slight dovish pivot, which led equities higher into the end of the month. This past month was the best July since 1939 and the best month for the overall market since November 2020.
Bear Market Bounce or is the Bottom in? The debate about the future direction of the market is heating up. We’ve now seen 4 bear market rallies this year. One of the observations that we’ve seen in recent months is that bear market rallies grow larger as the bear market grows older. Whether the Fed is close to being finished tightening or they are cutting rates, we imagine that every bear market rally during past bear markets (2000-03, 2007-09) generates the “it’s the bottom” conversation every time – this time is no different.
The Beginning of Quantitative Tightening: We are beginning a new regime as the Fed moves to reduce the size of its balance sheet which has grown to nearly $9 Trillion. Since March 2020, the Fed has made more than $4T in bond purchases. Now, to fight inflation, the Fed will begin to let some of their bonds mature (without replacing them). According to the central bank, roll offs will ramp up to $95 billion in September including a $60 billion reduction in U.S. Treasuries (“UST”) and a $35 billion reduction in Mortgage-Backed Securities (“MBS”). The first three months, however, have begun at half that pace; $47.5 billion, comprised of $30 billion UST and $17.5 billion MBS. That compares to a peak roll off of $50 billion a month when the Fed performed the exercise starting back in 2017. The Fed started this process in June.
Where is The Fed Put? We continue to believe that the Fed Put is much lower right now, as FOMC Chairman Jerome Powell has stated that the Fed is going to keep raising until we have a recession unless inflation meaningfully improves. The cause of the decline is equally important. The Fed has a long history of easing policy in response to earnings drops, but there isn’t much evidence that it responds to multiple compression. The fact that inflation is higher than at any time since the genesis of the Fed Put and that stocks have appreciated a lot over the past two years suggest the strike is well below current prices. Similarly, the recent decline in stock prices owes exclusively to lower multiples; it would take another leg down induced by a drop in earnings to impress the Fed.
Rate Hikes:The Fed raised rates again by 75 basis points in July, as the June CPI reading came in much structurally higher than expected. Now, the market is pricing in a 50 basis point hike in September. But after that the outlook is bit cloudier. The market has fully priced in 11 rates hikes in 2022. In 2023, we believe the market will start to price in rate cuts. We expect Powell’s tone to remain hawkish at future press conferences. Finally, financial conditions have already tightened significantly, for example the pop in mortgage rates is harming housing affordability and with further Fed tightening there will be more casualties to slow the economy further.
“Phantom Earnings” Moving Forward: Overall, 2022 consensus EPS are up modestly, but what is most noteworthy is how this earnings trend has skewed between indexes with small cap and value indexes seeing significantly more positive earnings revisions, while growth and larger cap indexes, more negative. We remain skeptics that the current 2023 earnings expectations for the S&P 500 remain too high. On average, earnings as a whole, tend to fall between 15% – 20, of which, earnings are only 2% off their highs.
Earnings Season So Far: Overall earnings season has shown signs of improvement – much better than anticipated by many economists. Of the companies that have reported, S&P 500 year-over-year earning growth now stands at +7.7%, with revenue growth increasing +12.1%. Energy continues to be the standout sector for profits masking the weakness in important sectors like Technology and Discretionary.
The U.S. Consumer: US consumer confidence dropped in June to the lowest in more than a year as inflation continues to dampen Americans’ economic views. The Consumer Confidence Index – a measure of expectations – which reflects consumers’ six-month outlook – dropped to the lowest in nearly a decade as Americans grew more downbeat about the outlook for the economy, labor market, and incomes. Consumer spending is about 70% of the US economy. If people start spending a lot less, then businesses lay off workers, which leads to even less consumer spending. As a result, unemployment could rise a lot. July saw a slight rebound.
S&P Valuation: The S&P 500 increased, along with the market in July – now trading at 18.1x or 2 turns higher than where it was trading at in the middle of June. This seems hard to justify given the growing concern about earnings. As a result, we continue to believe any near-term rally is nothing more than a bear market bounce with lower lows ahead.
Earnings: 2022 S&P 500 operating earnings = $225. 2023 = $246. 2021 = $204. 2020 = $136. 2019 = $161.
Valuations: S&P 500 Fwd. P/E: 18.1x, EAFE: 12.3x, EM: 10.7x, R1V: 13.9x, R1G: 24.3x, and R2K: 12.2x.
Disclosures
Aptus Capital Advisors, LLC is a Registered Investment Advisor (RIA) registered with the Securities and Exchange Commission and is headquartered in Fairhope, Alabama. Registration does not imply a certain level of skill or training. For more information about our firm, or to receive a copy of our disclosure Form ADV and Privacy Policy call (251) 517-7198 or contact us here. Information presented on this site is for educational purposes only and does not intend to make an offer or solicitation for the sale or purchase of any securities.
This commentary offers generalized research, not personalized investment advice. It is for informational purposes only and does not constitute a complete description of our investment services or performance. Nothing in this commentary should be interpreted to state or imply that past results are an indication of future investment returns. All investments involve risk and unless otherwise stated, are not guaranteed. Be sure to consult with an investment & tax professional before implementing any investment strategy.
Past performance is not indicative of future results. This material is not financial advice or an offer to sell any product. The information contained herein should not be considered a recommendation to purchase or sell any particular security. Forward looking statements cannot be guaranteed.
The S&P 500® is widely regarded as the best single gauge of large-cap U.S. equities. There is over USD 11.2 trillion indexed or benchmarked to the index, with indexed assets comprising approximately USD 4.6 trillion of this total. The index includes 500 leading companies and covers approximately 80% of available market capitalization.
The Nasdaq Composite Index measures all Nasdaq domestic and international based common type stocks listed on The Nasdaq Stock Market. To be eligible for inclusion in the Index, the security’s U.S. listing must be exclusively on The Nasdaq Stock Market (unless the security was dually listed on another U.S. market prior to January 1, 2004 and has continuously maintained such listing). The security types eligible for the Index include common stocks, ordinary shares, ADRs, shares of beneficial interest or limited partnership interests and tracking stocks. Security types not included in the Index are closed-end funds, convertible debentures, exchange traded funds, preferred stocks, rights, warrants, units and other derivative securities.
The Dow Jones Industrial Average® (The Dow®), is a price-weighted measure of 30 U.S. blue-chip companies. The index covers all industries except transportation and utilities.
The Russell 2000® Index measures the performance of the small-cap segment of the US equity universe. The Russell 2000® Index is a subset of the Russell 3000® Index representing approximately 10% of the total market capitalization of that index. It includes approximately 2,000 of the smallest securities based on a combination of their market cap and current index membership. The Russell 2000® is constructed to provide a comprehensive and unbiased small-cap barometer and is completely reconstituted annually to ensure larger stocks do not distort the performance and characteristics of the true small-cap opportunity set.
The MSCI EAFE Index is an equity index which captures large and mid-cap representation across 21 Developed Markets countries*around the world, excluding the US and Canada. With 902 constituents, the index covers approximately 85% of the free float-adjusted market capitalization in each country.
The MSCI Emerging Markets Index captures large and mid-cap representation across 26 Emerging Markets (EM) countries*. With 1,387 constituents, the index covers approximately 85% of the free float-adjusted market capitalization in each country.
Investment-grade Bond (or High-grade Bond) are believed to have a lower risk of default and receive higher ratings by the credit rating agencies. These bonds tend to be issued at lower yields than less creditworthy bonds.
Non-investment-grade debt securities (high-yield/junk bonds) may be subject to greater market fluctuations, risk of default or loss of income and principal than higher-rated securities.
The Bloomberg Barclays U.S. Aggregate Bond Index is a broad-based benchmark that measures the investment grade, U.S. dollar-denominated, fixed-rate taxable bond market. This includes Treasuries, government-related and corporate securities, mortgage-backed securities, asset-backed securities and collateralized mortgage-backed securities. ACA-2208-2.
