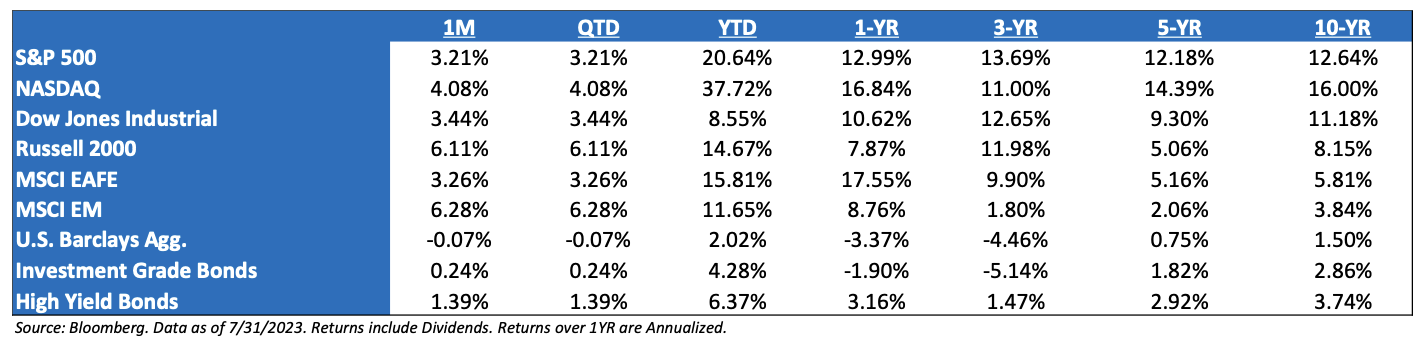
July ‘23 Market Recap: The S&P 500 gained 3.2% in July on a total return basis, the fifth month of gains and the ninth straight positive July. Less favorable seasonality in late summer has investors cautious, but lately, it appears that the path of least resistance remains up. Commodities topped asset class performance (+5.8%) and LT Treasuries were the only asset class to fall (-2.1%). Gold gained 2.2%, investment-grade bonds and cash were flattish 0.4%. Int’l lagged US equities in local currency (+2.8%) but led in USD terms (+4.1%) as the dollar sank. Breadth narrowed a bit in July, with 47% of stocks outperforming the index in July vs. 53% in June. But since June 1, the cap-weighted benchmark has lagged the equal-weighted benchmark.
Let’s Look to the History: Stocks continue one of their best years on record. With price-only S&P 500 data going back to 1927, this year ranks as the tenth best through July 31. Only 1933, 1987, 1975, 1997, 1989, 1954, 1995, 1943, and 1955 posted better returns through the first seven months of the year. Returns were mixed in the final five months of each of those years, but the majority saw stocks meander sideways between August and December. Total return data for the Nasdaq 100 only goes back to 1999, but 2023’s returns have been the best on record by a decent margin. With July’s conclusion the S&P 500 is now up roughly +11% on a year-over-year basis. That’s good for the 6th decile using data back to 1945 – nowhere near aggressive territory (room to run), but also a meaningful change from the 1st decile reading during 4Q ’22 (the home-run zone).
Earnings Season: Though off the highs forecasted roughly a year ago, ‘23 EPS estimates have turned up slightly, encouraging equity markets to trade higher. However, it seems that few institutional investors are buying into this reversing trend, choosing instead to camp out in the largest, most liquid, profitable names that have worked year-to-date. This is proving to further exacerbate the lack of market breadth. With marginal improvement during the reporting season, the annual 2023 EPS figure has moved higher by more than $1 from its lowest levels. What remains remarkable is that the consensus continues to believe that earnings growth in 2024 will be more than 12% while at the same time management has been rather reserved in their guidance for next year. As for this year, we have seen many companies guide as economic growth remains resilient.
Fitch Downgrade of US Federal Debt: On the exact date of the 12YR anniversary of the 2011 debt resolution, which ultimately led to the downgrade of US debt by S&P, Fitch downgraded the US federal debt. We believe that the downgrade itself is less important, but it comes at a time when the US has hit its fiscal inflection point of net interest costs hitting 14% of tax revenue and when debt servicing costs are rising for the first time in 35 years. The rating agencies are not going to force austerity on the US, but we are nearing the point at which investors have historically imposed that discipline. Unlike 2011’s downgrade, bond yields are increasing today, which feeds directly into interest costs.
Investors Can Choose their Narrative on All Macro Data: Macro data is still mixed with no clear sign that a recession is imminent or that one can be avoided. The jobs picture, much like many different macro points, paints an environment in which you can pick your own narrative. Investors have continued to see manufacturing PMIs be in contractionary territory, while services PMI remain in expansion. Macro is being held together by jobs, capex, and the consumer.
The Fed Update: The Fed also raised rates +25bp to 5.25%-5.5% at their meeting last week. The decision was unanimous. Chair Powell noted in his press conference that the U.S. labor market remained tight. Labor demand still exceeds labor supply, and notably the Fed staff is no longer forecasting a recession as the base case (ie, the event that would create a significant amount of slack is off the table for now).
What Concerns Us the Most: In short: 1) Continued volatility; 2) Inflation transitions to growth frustration; 3) The potential for a Fed policy error and continued collateral damage; 4) A general tendency to think about the economy and stock prices in V-shaped terms, i.e., a Fed Pivot saving the day.
S&P Valuation: As the market rallied in July, the S&P 500 P/E is now above 20x on a forward 12-month basis, placing it in the statistically expensive category and is trading at a historical premium to every asset class except 10YR Treasury bonds (whose valuation it has been rapidly approaching). The S&P 500 premium converging with the bond premium is not a coincidence: the S&P 500 resembles a long duration, low coupon bond – its composition is dominated by mega cap, long term growth stocks that typically don’t pay dividends, but flourished during QE. Both asset classes will likely do well if real rates fall from here.
Earnings: ‘22 S&P 500 op. earnings = $219 (+7.4%). 2023 = $223 (+1.8%). 2021 = $204. 2020 = $136. 2019 = $161. *
Valuations: S&P 500 Fwd. P/E (NTM): 22.9x, EAFE: 14.2x, EM: 13.5x, R1V: 17.3x, R1G: 31.2x, and R2K: 17.3x.*
*Source: Bloomberg and FactSet, Data as of 7/31/23
Disclosures
Aptus Capital Advisors, LLC is a Registered Investment Advisor (RIA) registered with the Securities and Exchange Commission and is headquartered in Fairhope, Alabama. Registration does not imply a certain level of skill or training. For more information about our firm, or to receive a copy of our disclosure Form ADV and Privacy Policy call (251) 517-7198 or contact us here. Information presented on this site is for educational purposes only and does not intend to make an offer or solicitation for the sale or purchase of any securities.
This commentary offers generalized research, not personalized investment advice. It is for informational purposes only and does not constitute a complete description of our investment services or performance. Nothing in this commentary should be interpreted to state or imply that past results are an indication of future investment returns. All investments involve risk and unless otherwise stated, are not guaranteed. Be sure to consult with an investment & tax professional before implementing any investment strategy.
Past performance is not indicative of future results. This material is not financial advice or an offer to sell any product. The information contained herein should not be considered a recommendation to purchase or sell any particular security. Forward looking statements cannot be guaranteed.
The S&P 500® is widely regarded as the best single gauge of large-cap U.S. equities. There is over USD 11.2 trillion indexed or benchmarked to the index, with indexed assets comprising approximately USD 4.6 trillion of this total. The index includes 500 leading companies and covers approximately 80% of available market capitalization.
The Nasdaq Composite Index measures all Nasdaq domestic and international based common type stocks listed on The Nasdaq Stock Market. To be eligible for inclusion in the Index, the security’s U.S. listing must be exclusively on The Nasdaq Stock Market (unless the security was dually listed on another U.S. market prior to January 1, 2004 and has continuously maintained such listing). The security types eligible for the Index include common stocks, ordinary shares, ADRs, shares of beneficial interest or limited partnership interests and tracking stocks. Security types not included in the Index are closed-end funds, convertible debentures, exchange traded funds, preferred stocks, rights, warrants, units and other derivative securities.
The Dow Jones Industrial Average® (The Dow®), is a price-weighted measure of 30 U.S. blue-chip companies. The index covers all industries except transportation and utilities.
The Russell 2000® Index measures the performance of the small-cap segment of the US equity universe. The Russell 2000® Index is a subset of the Russell 3000® Index representing approximately 10% of the total market capitalization of that index. It includes approximately 2,000 of the smallest securities based on a combination of their market cap and current index membership. The Russell 2000® is constructed to provide a comprehensive and unbiased small-cap barometer and is completely reconstituted annually to ensure larger stocks do not distort the performance and characteristics of the true small-cap opportunity set.
The MSCI EAFE Index is an equity index which captures large and mid-cap representation across 21 Developed Markets countries*around the world, excluding the US and Canada. With 902 constituents, the index covers approximately 85% of the free float-adjusted market capitalization in each country.
The MSCI Emerging Markets Index captures large and mid-cap representation across 26 Emerging Markets (EM) countries*. With 1,387 constituents, the index covers approximately 85% of the free float-adjusted market capitalization in each country.
Investment-grade Bond (or High-grade Bond) are believed to have a lower risk of default and receive higher ratings by the credit rating agencies. These bonds tend to be issued at lower yields than less creditworthy bonds.
Non-investment-grade debt securities (high-yield/junk bonds) may be subject to greater market fluctuations, risk of default or loss of income and principal than higher-rated securities.
Nasdaq-100® includes 100 of the largest domestic and international non-financial companies listed on the Nasdaq Stock Market based on market capitalization.
The Bloomberg Barclays U.S. Aggregate Bond Index is a broad-based benchmark that measures the investment grade, U.S. dollar-denominated, fixed-rate taxable bond market. This includes Treasuries, government-related and corporate securities, mortgage-backed securities, asset-backed securities, and collateralized mortgage-backed securities. ACA-2308-5.
