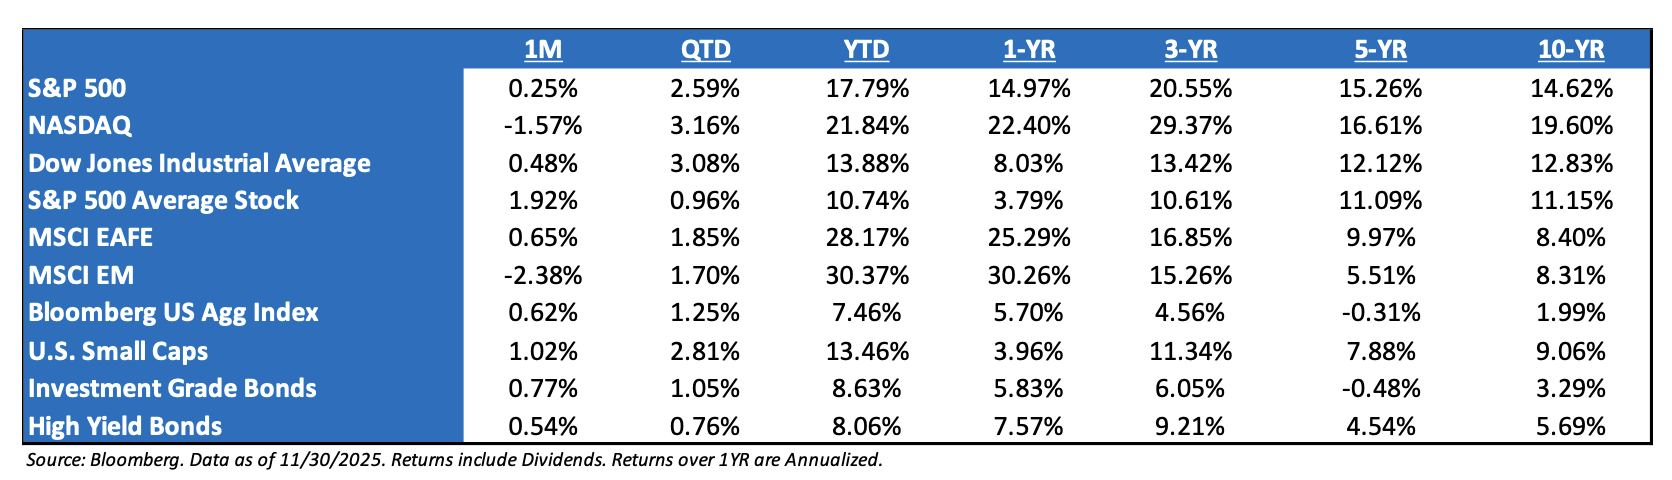
Market Recap November 2025: November wrapped up with a choppy, but ultimately modest month for U.S. equities, as a late-month rally helped the S&P 500 claw back from an early-November slide and finish roughly flat to slightly positive on a total-return basis. Under the surface, leadership narrowed, and volatility picked up, with the NASDAQ Composite posting a small decline for the month and logging one of its weaker showings of the year as several high-flying technology and artificial-intelligence names consolidated prior gains. The reversal coincided with shifting expectations around Federal Reserve policy, as investors weighed still-solid year-to-date gains against mixed signals on growth, inflation, and positioning heading into the final stretch of 2025. In the background, Treasury yields drifted slightly lower and futures priced in a high probability of another Fed rate cut in December, helping keep overall risk sentiment intact even as investors became more selective heading into year-end.
Federal Reserve Meeting Update: In October, the Federal Reserve cut interest rates by 0.25% to 3.75% – 4.00%, marking a 150bp reduction since rates began coming down last September. But Fed Chair Powell gave markets a hawkish surprise when he pushed back directly on the inevitability of a December rate cut. While Powell pushed back on expectations for a December rate cut, it’s entirely possible we still get one. To that point, the official FOMC statement, which reflects the consensus of the FOMC, kept forward guidance unchanged and clearly exhibited an easing bias. That tells us the consensus of the FOMC still sees rate cuts as appropriate. Powell did little to imply the rate-cutting cycle has ended. That’s important because it’s not so much which month the Fed cuts rates as it is the fact that they are still cutting rates. Bottom line, if Powell and other Fed officials imply that we’ll be on another extended pause, that would be more negative for markets. Bottom line, a December cut may not be a foregone conclusion, but the Fed is still cutting rates, and that’s what matters most to stocks.
Earnings Season Recap: Earnings for Q3 ’25 have been strong across the board, coming in at over +16% year-over-year. Every sector exceeded its initial estimates, and 11 of the 11 sectors also surpassed expectations on the bottom line. With so much discussion around a potential market slowdown or even a recession, it’s hard to reconcile those concerns with an economy that’s moving from roughly double-digit growth to no growth at all. Putting this in perspective, the market continues to underestimate the amount of operating leverage embedded in the S&P 500, as the market was only expecting earnings growth in Q3 of 8.8% (as of 10/1/2025) – the actual growth rate was 16.9%.
The Artificial Intelligence Capex Trade Continues to Work: The Q3 earnings season has catalyzed another move higher in AI capex estimates alongside renewed investor concerns surrounding the risks associated with the AI investment boom. Consensus 2026 capex estimates for the AI hyperscalers (AMZN, GOOGL, META, MSFT, and ORCL) have risen from $467B (+20% YoY growth) at the start of the earnings season to $533B today (+34%YoY). The “AI trade” has remained concentrated within the infrastructure complex, but return dispersion across that complex has increased. Much of the dispersion has been driven by the degree of investor confidence that AI investments are generating revenue benefits. The magnitude of leverage used to fund those investments has also contributed to the return dispersion. Cash flows and balance sheet capacity are unlikely to constrain large public AI hyperscaler capex spending in 2026. While the vast majority of hyperscaler capex has so far been funded out of cash flows, many of these companies have the capacity for substantial debt funding as well. Since 2021, the hyperscalers have collectively increased the net debt on their balance sheets by $295 billion, but their collective net debt/EBITDA leverage remains just +0.2x.
Are We in an AI Bubble? Only time will tell if we are in a bubble, but let’s frame this question differently. Fears of asset bubbles popping have been drilled into every investor’s head since the “tulipmania” of the 1630s. Specifically, we’re taught that all booms lead to busts. But are all frenzies bad? Bubbles both create and destroy wealth. Perhaps a more nuanced approach is needed. Many modern technologies were accompanied by overenthusiastic investment (railroads, cars, airlines, computers). So, is there a way to do a cost-benefit analysis, rather than just a cost analysis, on bubbles? The key lies in what the boom produces and how it is financed. The worst possible kind of bubble is a bubble in unproductive assets (gold, land, tulips) financed by banks. The best possible kind of bubble (i.e., one that does not hurt growth too badly) is a bubble in productive assets, financed by capital markets. The Japanese bubble of the late 1980s and the US real estate bubble of the mid-2000s were ‘bad’ bubbles. By contrast, the “dot.com” bubble of the late 1990s was a ‘good’ bubble. A bubble in a productive asset financed by equity can work out without too much trouble (equity is known to be a “risky” asset). There’s a short-term cost, but a long-term benefit (i.e., a new technology).
What to Focus On Right Now: In my opinion, the market is not political. It doesn’t care about draining swamps, political retribution, woke or anti-woke campaigns, or DEI initiatives. The market only cares about policies that:
-
- Profit Growth Continues to Trend Higher. With Q3 earnings season wrapped up, the fundamental backdrop for equities remains supportive as we move toward 2026. As of the end of November, the next twelve-month earnings growth stands at 12.5%, the highest level since January 2025. If there’s one area of fundamental risk, it’s the continued concentration within the index – it can drive markets higher or lower. The top 10 companies now account for about one-third of total net income, meaning a miss from any major large-cap contributors could materially affect the overall earnings outlook. For now, though, growth remains robust for both 2025 and 2026.
- Understanding the 2026 Narrative. Today’s narrative largely centers on two themes: continued AI-related capital expenditures, albeit at a slower pace, and the potential for an economic reacceleration supported by fiscal stimulus and Federal Reserve policy. While AI Capex growth will naturally moderate after such outsized investment levels, a key question is whether companies that issue debt to fund this spending will continue to receive the same valuation multiples they enjoyed earlier in the cycle. As for the prospect of an economic reacceleration, the question now is whether consumer momentum can be sustained through year-end before the fiscal stimulus starts to take effect in 2026.
S&P 500 EPS:’26 (Exp.) EPS = $294.22 (+10.9%). ’25 (Exp.) EPS = $265.30 (+8.2%). ‘24 EPS = $245.16 (+11.5%). 2023 = $220 (+8.6%). 2022 = $219 (+0.5%).
Valuations: S&P 500 Fwd. P/E (NTM): 22.0x, EAFE: 17.9x, EM: 14.2x, R1V: 18.3x, and R1G: 30.3x. *
*Source: Bloomberg and FactSet, Data as of 11/30/2025
Disclosures
Aptus Capital Advisors, LLC is a Registered Investment Advisor (RIA) registered with the Securities and Exchange Commission and is headquartered in Fairhope, Alabama. Registration does not imply a certain level of skill or training. For more information about our firm, or to receive a copy of our disclosure Form ADV and Privacy Policy call (251) 517-7198 or contact us here. Information presented on this site is for educational purposes only and does not intend to make an offer or solicitation for the sale or purchase of any securities.
This commentary offers generalized research, not personalized investment advice. It is for informational purposes only and does not constitute a complete description of our investment services or performance. Nothing in this commentary should be interpreted to state or imply that past results are an indication of future investment returns. All investments involve risk and unless otherwise stated, are not guaranteed. Be sure to consult with an investment & tax professional before implementing any investment strategy.
Past performance is not indicative of future results. This material is not financial advice or an offer to sell any product. The information contained herein should not be considered a recommendation to purchase or sell any particular security. Forward-looking statements cannot be guaranteed.
The S&P 500® is widely regarded as the best single gauge of large-cap U.S. equities. There is over USD 11.2 trillion indexed or benchmarked to the index, with indexed assets comprising approximately USD 4.6 trillion of this total. The index includes 500 leading companies and covers approximately 80% of available market capitalization.
The Nasdaq Composite Index measures all Nasdaq domestic and international-based common type stocks listed on The Nasdaq Stock Market. To be eligible for inclusion in the Index, the security’s U.S. listing must be exclusively on The Nasdaq Stock Market (unless the security was dually listed on another U.S. market prior to January 1, 2004 and has continuously maintained such listing). The security types eligible for the Index include common stocks, ordinary shares, ADRs, shares of beneficial interest or limited partnership interests and tracking stocks. Security types not included in the Index are closed-end funds, convertible debentures, exchange traded funds, preferred stocks, rights, warrants, units and other derivative securities.
The Dow Jones Industrial Average® (The Dow®), is a price-weighted measure of 30 U.S. blue-chip companies. The index covers all industries except transportation and utilities.
The MSCI EAFE Index is an equity index which captures large and mid-cap representation across 21 Developed Markets countries*around the world, excluding the US and Canada. With 902 constituents, the index covers approximately 85% of the free float-adjusted market capitalization in each country.
The MSCI Emerging Markets Index captures large and mid-cap representation across 26 Emerging Markets (EM) countries*. With 1,387 constituents, the index covers approximately 85% of the free float-adjusted market capitalization in each country.
Investment-grade Bond (or High-grade Bond) are believed to have a lower risk of default and receive higher ratings by the credit rating agencies. These bonds tend to be issued at lower yields than less creditworthy bonds.
Non-investment-grade debt securities (high-yield/junk bonds) may be subject to greater market fluctuations, risk of default or loss of income and principal than higher-rated securities.
Nasdaq-100® includes 100 of the largest domestic and international non-financial companies listed on the Nasdaq Stock Market based on market capitalization.
The Bloomberg Barclays U.S. Aggregate Bond Index is a broad-based benchmark that measures the investment grade, U.S. dollar-denominated, fixed-rate taxable bond market. This includes Treasuries, government-related and corporate securities, mortgage-backed securities, asset-backed securities, and collateralized mortgage-backed securities. ACA-2512-2.
