January ‘23 Market Recap: The “January Effect” was in full order this past month. The worst performing sectors in 2022 led last month: Consumer Discretionary (+15%) and Communication Services (+14%). Meanwhile, defensive Utilities (-2%) and Staples (-1%) were the only sectors in the red. Risk factors were the best-performing style group (+13% on avg.) while Momentum factors lagged most (+4% on avg.). And consistent with what we typically see in January, Low Quality stocks (B or Worse) outperformed High Quality stocks (B+ or better) by 8ppt. The equal-weighted S&P 500 (+7.6%) outperformed the cap-weighted index despite the rally in some of the index’s largest stocks/sectors (and the Nasdaq +11%), and the Nifty 50 (+6.1%) lagged the Other 450 (+6.2%).
A Real “January Effect” Means Small Cap Outperformance: We saw a true “January Effect” with small beating large, smallest of small leading way, along with cheapest, lowest ROE driving performance. For trivia buffs, this bodes well for the rest of the year with small averaging a rise of 13% next 11-months vs. 11% for overall period.
A Shift from Macro to Micro: We have lived in a macro market for the last three years, driven by shocks: COVID, the biggest fiscal package ever, an aggressive Fed hiking cycle to curb outsized inflation. Now, assuming central banks are successful in taming inflation, micro factors could take the reins. Sector dynamics and company-specific factors should play a bigger role in performance differentiation. Triggers for this shift include confidence building among investors that we are nearing the end of a hiking cycle, as well as more visibility around the timing and depth of a recession. But a number of cross currents are likely to complicate 2023, resulting in outcomes not necessarily found in a classic market cycle playbook.
Value v. Growth: The Russell 1000 Growth Index (+8.3%) beat the Russell 1000 Value Index (+5.2%) last month, after Value led by 22% last year. But the S&P Value index (+7.0%) led the S&P Growth Index (+5.6%), and the Value factors we track within the S&P 500 (+10% on avg.) outperformed Growth factors we track (+7% on avg.). While Value vs. Growth is likely to be more nuanced into a recession, we continue to prefer quality and cash-flow based Value over long duration, still crowded Growth stocks.
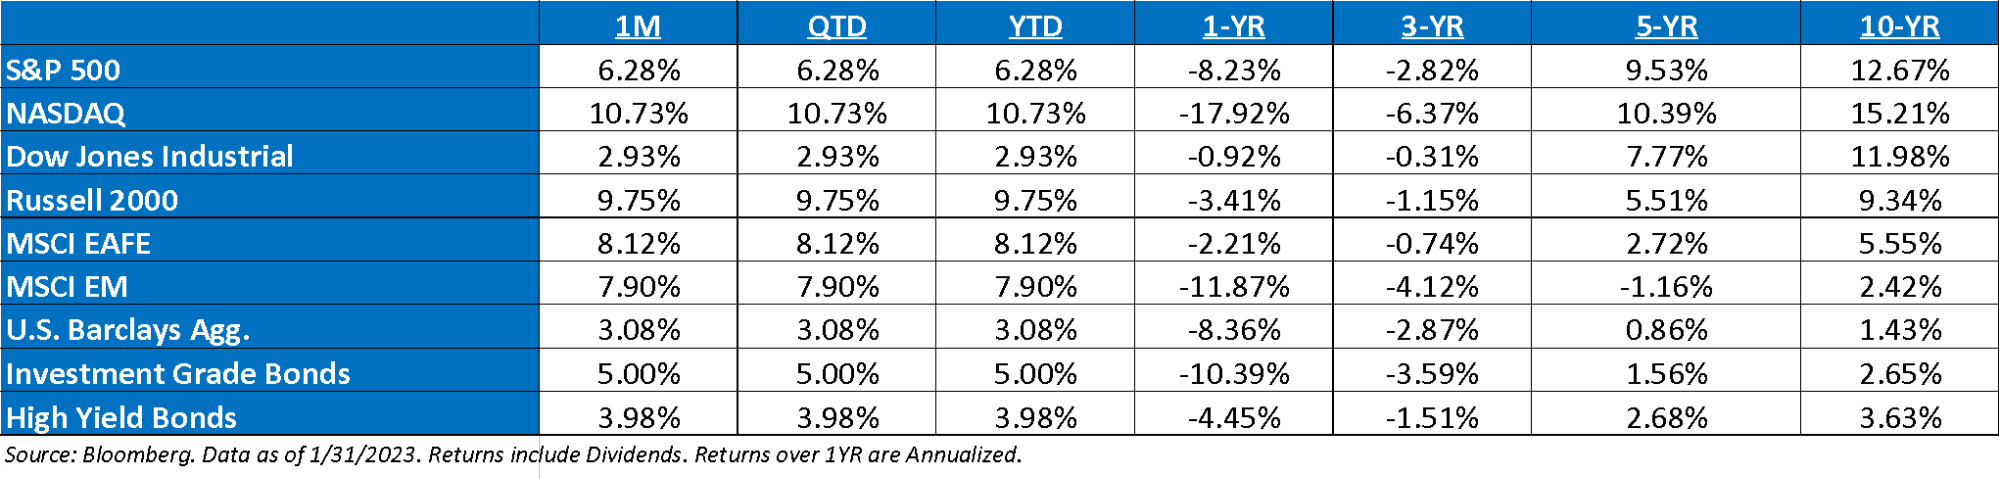
Asset Allocation Returns: The 60/40 stock/bond portfolio bounced back after the worst year in history (+6.2% in January, a 96th percentile month in history since 1921). Following a dramatic decline in equity sentiment last year, the S&P 500 bounced back with a +6.3% total return, recouping the losses from December. We view the rally as sentiment-driven, given how bearish consensus was on 1H23 heading into this year. Bonds also rallied, with Long-Term Treasuries +6.2% (95th percentile total return) amid a drop in yields (10yr -37bp). Investment grade corp. bonds were +3.9%; gold was +6.2%.
Earnings Season Update: The Q4 reporting season continues to underwhelm with earnings growth expected to decline more than what was anticipated at the beginning of the year. Revenue growth is meeting analyst expectations but is considerably slower than in past quarters and will likely continue to slow further in the future. The dynamic of +4% sales growth and -3% earnings growth gives one an idea of how much pressure margins are really facing now. Since the beginning of the year, earnings estimates for the year have been lowered by more than five dollars for the S&P 500 and now sit at $225. The growth rate is now expected to be just 2.6%. Our view remains that earnings are still too high for this year. Margins will continue to face pressure, and energy’s outsized contribution is likely going to shrink.
Recent Fed Commentary: There continues to be a large discrepancy between the price of the terminal rate (shown via Fed Funds futures) and the Fed’s Dot Plot. While Powell acknowledged that inflation has come off peak levels, monetary policy makers remain committed to a further rise in rates to reinstate price stability. Powell spoke of the need for ongoing increases (plural). Ultimately, from a hawk’s perspective, this verbiage was big in its emphasis on the need for more hikes and higher for long. This was a slowdown, not a pivot.
S&P Valuation: The S&P 500 valuation increased over the month, as the market rallied 6.2%, which trumped the 2% decrease in earnings expectations. The market trades at 18.5x (17.2x last month).
Earnings: ‘22 S&P 500 op. earnings = $220 (+7.7%). 2023 = $225 (+2.6%). 2021 = $204. 2020 = $136. 2019 = $161. *
Valuations: S&P 500 Fwd. P/E: 18.5x, EAFE: 13.2x, EM: 10.2x, R1V: 15.9x, R1G: 25.2x, and R2K: 12.8x. *
*Source: Bloomberg and FactSet, Data as of 1/31/23
Disclosures
Aptus Capital Advisors, LLC is a Registered Investment Advisor (RIA) registered with the Securities and Exchange Commission and is headquartered in Fairhope, Alabama. Registration does not imply a certain level of skill or training. For more information about our firm, or to receive a copy of our disclosure Form ADV and Privacy Policy call (251) 517-7198 or contact us here. Information presented on this site is for educational purposes only and does not intend to make an offer or solicitation for the sale or purchase of any securities.
This commentary offers generalized research, not personalized investment advice. It is for informational purposes only and does not constitute a complete description of our investment services or performance. Nothing in this commentary should be interpreted to state or imply that past results are an indication of future investment returns. All investments involve risk and unless otherwise stated, are not guaranteed. Be sure to consult with an investment & tax professional before implementing any investment strategy.
Past performance is not indicative of future results. This material is not financial advice or an offer to sell any product. The information contained herein should not be considered a recommendation to purchase or sell any particular security. Forward looking statements cannot be guaranteed.
The S&P 500® is widely regarded as the best single gauge of large-cap U.S. equities. There is over USD 11.2 trillion indexed or benchmarked to the index, with indexed assets comprising approximately USD 4.6 trillion of this total. The index includes 500 leading companies and covers approximately 80% of available market capitalization. The S&P 500® Growth measures growth stocks using three factors: sales growth, the ratio of earnings change to price, and momentum. Constituents are drawn from the S&P 500®. The S&P 500® Value measures value stocks using three factors: the ratios of book value, earnings, and sales to price. Constituents are drawn from the S&P 500®.
The Nasdaq Composite Index measures all Nasdaq domestic and international based common type stocks listed on The Nasdaq Stock Market. To be eligible for inclusion in the Index, the security’s U.S. listing must be exclusively on The Nasdaq Stock Market (unless the security was dually listed on another U.S. market prior to January 1, 2004 and has continuously maintained such listing). The security types eligible for the Index include common stocks, ordinary shares, ADRs, shares of beneficial interest or limited partnership interests and tracking stocks. Security types not included in the Index are closed-end funds, convertible debentures, exchange traded funds, preferred stocks, rights, warrants, units and other derivative securities.
The Dow Jones Industrial Average® (The Dow®), is a price-weighted measure of 30 U.S. blue-chip companies. The index covers all industries except transportation and utilities.
The Russell 2000® Index measures the performance of the small-cap segment of the US equity universe. The Russell 2000® Index is a subset of the Russell 3000® Index representing approximately 10% of the total market capitalization of that index. It includes approximately 2,000 of the smallest securities based on a combination of their market cap and current index membership. The Russell 2000® is constructed to provide a comprehensive and unbiased small-cap barometer and is completely reconstituted annually to ensure larger stocks do not distort the performance and characteristics of the true small-cap opportunity set.
The Russell 1000® Growth Index is an unmanaged, market capitalization-weighted index that measures the performance of those companies in the Russell 1000 Index with higher price-to-book ratios and higher forecasted growth values. The Russell 1000® Value Index measures the performance of the large cap value segment of the U.S. equity universe. It includes those Russell 1000Ò Index companies with lower price-to-book ratios and lower expected growth values.
The MSCI EAFE Index is an equity index which captures large and mid-cap representation across 21 Developed Markets countries*around the world, excluding the US and Canada. With 902 constituents, the index covers approximately 85% of the free float-adjusted market capitalization in each country.
The MSCI Emerging Markets Index captures large and mid-cap representation across 26 Emerging Markets (EM) countries*. With 1,387 constituents, the index covers approximately 85% of the free float-adjusted market capitalization in each country.
Investment-grade Bond (or High-grade Bond) are believed to have a lower risk of default and receive higher ratings by the credit rating agencies. These bonds tend to be issued at lower yields than less creditworthy bonds.
Non-investment-grade debt securities (high-yield/junk bonds) may be subject to greater market fluctuations, risk of default or loss of income and principal than higher-rated securities.
Nasdaq-100® includes 100 of the largest domestic and international non-financial companies listed on the Nasdaq Stock Market based on market capitalization.
The Bloomberg Barclays U.S. Aggregate Bond Index is a broad-based benchmark that measures the investment grade, U.S. dollar-denominated, fixed-rate taxable bond market. This includes Treasuries, government-related and corporate securities, mortgage-backed securities, asset-backed securities, and collateralized mortgage-backed securities. ACA-2302-2.
