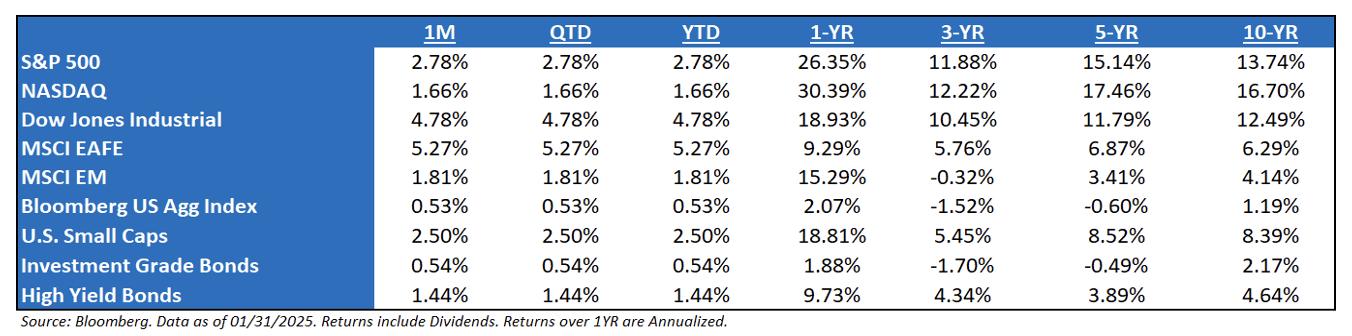
Market Recap – January 2025: It was a very interesting month, as the market navigated a slew of headlines that, at first glance, seemed to be potential negative game changers for the market. 1) Threat of tariffs, and 2) Ramifications of DeepSeek. Yet, the market continued to rally, after a very strong 2024, as corporate earnings remained strong. The market saw a broadening out in returns, as the stocks that performed well last year underperformed in January, and vice versa. Even International performed well, but, fitful rallies occur, and we need to be reminded of the fundamental story. The market is expecting US GDP to grow at 2.6%, core inflation ending at 2.5%, and S&P earnings growth of 14%. Now stack those against Europe, where GDP is expected to grow just 0.8%, core inflation ending at 2.3%, and EuroStoxx earnings growth of 3%. Overall, January 2025 was characterized by cautious optimism, with markets navigating a delicate balance between economic growth potential and inflationary concerns. Investors continued to monitor central bank policies closely, as interest rate movements and fiscal measures remained key drivers of market performance for the year ahead.
DeepSeek and the Ramifications: The question that the market is trying to decipher is this: Are we going to start witnessing the transition of “Performance-at-all-Cost” to “Optimization“. Here are our knee-jerk reactions to market ramifications:
-
- A lot of the sell-off was focused in the areas of the market that have witnessed the largest earnings growth potential or valuation expansion based off of the AI-narrative trade. This tells me that there was a liquidity event where a lot of heavily leveraged players became forced sellers. Meaning that the market weakness may not be a structural narrative shift.
-
- Only the AI-focused names were hit the hardest – the rest of the market did fine. In fact, on the day that DeepSeek was announced, over 70% of the S&P 500 were positive. This means that the market has not given up on the AI story. It’s only questioning the amount of capex needed for many of these companies to create efficiency from AI, negating some potential spending in the future (i.e., one company’s capex spend is another company’s revenue). But, the rest of the market responded well, meaning that the market continues to understand the new technology as a way to create more efficiencies for the average company, which should be the largest beneficiary of AGI.
Are Tariffs a Bearish Gamechanger? Not yet. Clearly this is an incremental negative because it’s another case of one of the bullish forces in this market being removed or sidelined. Since December, investors have seen several bullish factors negatively impacted. First, the Fed’s “hawkish cut” in December put a pause on the table and removed the idea of consistent rate cuts. Second, the DeepSeek news dealt a potentially serious blow to AI enthusiasm, so the market may be losing upside momentum from the largest and most important market sector (tech). Now, the market is losing the expectation for pro-growth policy from Washington. Now, tariffs are a not bearish game changer or a reason to reduce equity exposure today because earnings and economic growth (the two most important foundational forces for stocks) are still solid. But the factors that push stocks higher are being weakened or eliminated one by one and the factors that could push stocks lower are being increased and that’s a potential problem for a market so richly valued.
Fed Update: At the beginning of last year, the terminal rate was expected to be ~3.0%, but with the inflation proving to be stickier, and the potential remaining for a re-acceleration, the bar has shifted to a level closer to ~3.8%. Put differently, while fewer-than-expected rate cuts are a disappointment in the near term compared to market expectations, the facts tell us that the rate-cutting cycle is still in place, and, as a result, Fed policy remains supportive for stocks – maybe just less than before.
The Burden of Proof Remains with the Bears: Put simply, while the economy is slowing, the news has not been bad enough yet to cause a sustainable decline in stocks. The Fed’s easing cycle, coupled with “OK” macroeconomic data, has kept earnings forecasts steady.
-
- What Bears are Saying: Rising unemployment, weak ISM Manufacturing PMI, and negative earnings guidance hint at challenges ahead. Concerns also include political uncertainty (domestic and global) and geopolitical risks (Russia/Ukraine, Israel/Hamas).
-
- What Bulls are Saying: 1) Still “ok” economic data—slowing, but not alarmingly so, 2) The initial market rally due to anticipated Fed rate cuts, 3) Earnings growth, still strong at over 10% year-over-year, and 4) Optimism around AI advancements.
First Year of a New Presidential Cycle: Until recently, it was a decent bet that the second half of a President’s term would be better for market performance than the first. Generally speaking, Presidents would make the hard decisions when their political capital was at its highest and then let it rip as they sought re-election. All that seemed to change with the election of President Obama, the introduction of QE, and the budget deficits that accompanied it. Since 2005, the best year for market returns has been the first year of a Presidential term – and it’s by an enormous margin.
Politics and Markets: The market is not political. It doesn’t care about political retribution, woke or anti-woke campaigns, or DEI initiatives. The market only cares about policies that:
-
- Increase (or decrease) earnings, and
- Support growth (or hinder it).
Any political movement or agenda that is viewed by the market as getting in the way of better earnings and growth will be viewed as negative and be a headwind on risk assets, regardless of whether those policies are from Republicans or Democrats. This is the way we must view political coverage over the next year (and likely four years) and this will help us cut through the noise and stay focused on the policies that will impact markets.
S&P 500 EPS: ’25 (Exp.) EPS = $275. ‘24 EPS = $239 (+15.1%). 2023 = $220 (+8.6%). 2022 = $219 (+0.5%). 2021 = $204.*
Valuations: S&P 500 Fwd. P/E (NTM): 22.1x, EAFE: 14.6x, EM: 11.9x, R1V: 17.2x, and R1G: 28.8x. *
*Source: Bloomberg and FactSet, Data as of 1/31/25
Disclosures
Aptus Capital Advisors, LLC is a Registered Investment Advisor (RIA) registered with the Securities and Exchange Commission and is headquartered in Fairhope, Alabama. Registration does not imply a certain level of skill or training. For more information about our firm, or to receive a copy of our disclosure Form ADV and Privacy Policy call (251) 517-7198 or contact us here. Information presented on this site is for educational purposes only and does not intend to make an offer or solicitation for the sale or purchase of any securities.
This commentary offers generalized research, not personalized investment advice. It is for informational purposes only and does not constitute a complete description of our investment services or performance. Nothing in this commentary should be interpreted to state or imply that past results are an indication of future investment returns. All investments involve risk and unless otherwise stated, are not guaranteed. Be sure to consult with an investment & tax professional before implementing any investment strategy.
Past performance is not indicative of future results. This material is not financial advice or an offer to sell any product. The information contained herein should not be considered a recommendation to purchase or sell any particular security. Forward looking statements cannot be guaranteed.
The S&P 500® is widely regarded as the best single gauge of large-cap U.S. equities. There is over USD 11.2 trillion indexed or benchmarked to the index, with indexed assets comprising approximately USD 4.6 trillion of this total. The index includes 500 leading companies and covers approximately 80% of available market capitalization.
The Nasdaq Composite Index measures all Nasdaq domestic and international based common type stocks listed on The Nasdaq Stock Market. To be eligible for inclusion in the Index, the security’s U.S. listing must be exclusively on The Nasdaq Stock Market (unless the security was dually listed on another U.S. market prior to January 1, 2004 and has continuously maintained such listing). The security types eligible for the Index include common stocks, ordinary shares, ADRs, shares of beneficial interest or limited partnership interests and tracking stocks. Security types not included in the Index are closed-end funds, convertible debentures, exchange traded funds, preferred stocks, rights, warrants, units and other derivative securities.
The Dow Jones Industrial Average® (The Dow®), is a price-weighted measure of 30 U.S. blue-chip companies. The index covers all industries except transportation and utilities.
The MSCI EAFE Index is an equity index which captures large and mid-cap representation across 21 Developed Markets countries*around the world, excluding the US and Canada. With 902 constituents, the index covers approximately 85% of the free float-adjusted market capitalization in each country.
The MSCI Emerging Markets Index captures large and mid-cap representation across 26 Emerging Markets (EM) countries*. With 1,387 constituents, the index covers approximately 85% of the free float-adjusted market capitalization in each country.
Investment-grade Bond (or High-grade Bond) are believed to have a lower risk of default and receive higher ratings by the credit rating agencies. These bonds tend to be issued at lower yields than less creditworthy bonds.
Non-investment-grade debt securities (high-yield/junk bonds) may be subject to greater market fluctuations, risk of default or loss of income and principal than higher-rated securities.
Nasdaq-100® includes 100 of the largest domestic and international non-financial companies listed on the Nasdaq Stock Market based on market capitalization.
The Bloomberg Barclays U.S. Aggregate Bond Index is a broad-based benchmark that measures the investment grade, U.S. dollar-denominated, fixed-rate taxable bond market. This includes Treasuries, government-related and corporate securities, mortgage-backed securities, asset-backed securities, and collateralized mortgage-backed securities. ACA-2502-1.
