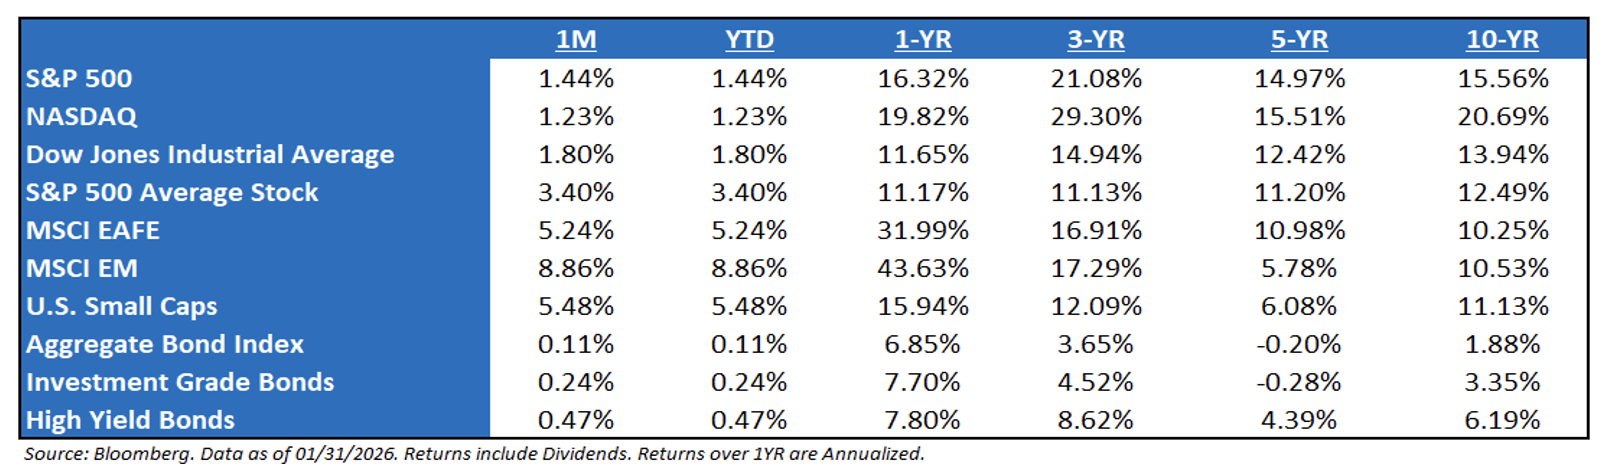
Market Recap → A Month of Headline Digestion: The theme of January is perhaps best captured in how the black swan events that cropped up— Venezuela, Japan, Greenland—were unable to derail the cyclical and secular momentum that has been driving stocks for much of the post-pandemic echo-boom era. U.S. stocks started 2026 on a positive but choppy note, with the S&P 500 up 1.44%, as investors digested strong 2025 gains, still‑easy policy, and the first big wave of earnings reports. The advance kept the “January barometer” flashing green, a pattern that has often, though not always, preceded solid full‑year returns for equities. Beneath the index level, risk appetite stayed firm as credit spreads hovered near multi‑decade lows and core bonds came off their best year since 2020. Macro drivers remained supportive, with fiscal and monetary settings still far from restrictive and corporate fundamentals generally healthy, helping markets shrug off geopolitical noise and bouts of volatility. Overall, January felt less like a fresh regime and more like an extension of late‑
New Fed Chair Announced: Markets tend to always challenge the new Fed Chair. We believe that he’s not as “Hawkish” as many first thought, but there are two reasons the market was mildly disappointed by the Warsh nomination:
-
- First, he’s made some less-than-supportive comments about QE. Last summer, Warsh spoke about QE being “reverse Robin Hood” in that it benefits asset holders more than non-asset holders. Specifically, Warsh thinks QE compounds inequality in the economy, and he’s likely correct. However, QE has become an integral part of Fed policy, and many believe it is critical to the massive appreciation in asset prices over the past 17 years. Abandoning or altering the Fed’s reliance on QE would be a significant shift in Fed policy, and markets will want to hear from Warsh about his commitment to QE.
- Second, Warsh called for “regime change” at the Fed, essentially saying that the people running the Fed (Powell, etc.) are the same people who let the inflation genie out of the bottle, and because of that, there needs to be new leadership that can restore credibility from the public. Again, that’s not necessarily a bad thing (his comments aren’t totally off base), but markets will want to hear more specificity on what exactly “regime change” means in the coming weeks. Bottom line, markets don’t “hate” the Warsh choice, but markets view the Fed as a major ingredient of the 10+ year bull market in stocks and risk assets, so any potential change makes investors nervous.
The Artificial Intelligence Capex Trade Continues to Work, But Is It a Risk? The markets are struggling to price a technology that is advancing at an exponential rate. While markets appear undeterred, even with solid fundamentals, they can have a correction. We believe there is a difference between a bubble and an air pocket. While we don’t believe that we are currently in the former, the latter is a possibility. The boom in tech stocks and AI spending could lose its luster, even if temporarily. While few doubt the potential transformative impact of AI, a shift in momentum could be triggered by a range of factors (i.e., a miss on mega cap earnings, a supply crunch on power or critical materials, or an external liquidity shock). Given the significance of AI investment, such a slowdown could cause a swift pullback in the overall market, or at a minimum, pressure the AI-linked wealth gains that have lifted consumption.
Are We in an AI Bubble? Only time will tell if we are in a bubble, but let’s frame this question differently. Fears of asset bubbles popping have been drilled into every investor’s head since the “tulipmania” of the 1630s. Specifically, we’re taught that all booms lead to busts. But are all frenzies bad? Bubbles both create and destroy wealth. Perhaps a more nuanced approach is needed. Many modern technologies were accompanied by overenthusiastic investment (railroads, cars, airlines, computers). So, is there a way to do a cost-benefit analysis, rather than just a cost analysis, on bubbles? The key lies in what the boom produces and how it is financed. The worst possible kind of bubble is a bubble in unproductive assets (gold, land, tulips) financed by banks. The best possible kind of bubble (i.e., one that does not hurt growth too badly) is a bubble in productive assets, financed by capital markets. The Japanese bubble of the late 1980s and the US real estate bubble of the mid-2000s were ‘bad’ bubbles. By contrast, the “dot.com” bubble of the late 1990s was a ‘good’ bubble. A bubble in a productive asset financed by equity can work out without too much trouble (equity is known to be a “risky” asset). There’s a short-term cost, but a long-term benefit (i.e., a new technology).
The Dollar: The dollar bears appear to be going crazy right now, but it’s likely a reversion back to the dollar mean. All currencies are being debased, some faster than others. And right now, it’s the U.S. dollar. This means that there is a necessity to own assets that can outpace debasement. If investors take a step back and look at the shorter term, what is happening to the dollar right now is not causing alarm bells to go off. First, the dollar is just working its way back to the pre-COVID average. The U.S. dollar’s valuation pre-COVID (DXY Index) is currently at 97.6, and pre-2020, the value of the U.S. dollar was consistently in the 95-100 range, i.e., a reversion to the mean.
What to Focus on Right Now:
-
- Profit Growth Continues to Trend Higher – With Q4 earnings season beginning, the fundamental backdrop for equities remains supportive as we move toward a mid-term election year. As of the end of January, the next twelve-month earnings growth stands at 14.0%, the highest level since January 2025. If there’s one area of fundamental risk, it’s the continued concentration within the index – it can drive markets higher or lower. The top 10 companies now account for about one-third of total net income, meaning a miss from any major large-cap contributors could materially affect the overall earnings outlook. For now, though, growth remains robust.
- Understanding the 2026 Narrative – Today’s narrative largely centers on two themes: continued AI-related capital expenditures, albeit at a slower pace, and the potential for an economic reacceleration supported by fiscal stimulus and Federal Reserve policy. While AI Capex growth will naturally moderate after such outsized investment levels, a key question is whether companies that issue debt to fund this spending will continue to receive the same valuation multiples they enjoyed earlier in the cycle. As for the prospect of an economic reacceleration, the question now is whether consumer momentum can be sustained through year-end before the fiscal stimulus starts to take effect in 2026.
S&P 500 EPS: ’26 (Exp.) EPS = $309.80 (+14.0%). ’25 (Exp.) EPS = $271.80 (+10.9%). ‘24 EPS = $245.16 (+11.5%). 2023 = $220 (+8.6%). 2022 = $219 (+0.5%).
Valuations: S&P 500 Fwd. P/E (NTM): 21.9x, NASDAQ: 26.5x, EAFE: 16.3x, EM: 13.0x, R1V: 17.9x, and R1G: 27.0x. *
*Source: Bloomberg and FactSet, Data as of 01/31/2026
Disclosures
Aptus Capital Advisors, LLC is a Registered Investment Advisor (RIA) registered with the Securities and Exchange Commission and is headquartered in Fairhope, Alabama. Registration does not imply a certain level of skill or training. For more information about our firm, or to receive a copy of our disclosure Form ADV and Privacy Policy call (251) 517-7198 or contact us here. Information presented on this site is for educational purposes only and does not intend to make an offer or solicitation for the sale or purchase of any securities.
This commentary offers generalized research, not personalized investment advice. It is for informational purposes only and does not constitute a complete description of our investment services or performance. Nothing in this commentary should be interpreted to state or imply that past results are an indication of future investment returns. All investments involve risk and unless otherwise stated, are not guaranteed. Be sure to consult with an investment & tax professional before implementing any investment strategy.
Past performance is not indicative of future results. This material is not financial advice or an offer to sell any product. The information contained herein should not be considered a recommendation to purchase or sell any particular security. Forward-looking statements cannot be guaranteed.
The S&P 500® is widely regarded as the best single gauge of large-cap U.S. equities. There is over USD 11.2 trillion indexed or benchmarked to the index, with indexed assets comprising approximately USD 4.6 trillion of this total. The index includes 500 leading companies and covers approximately 80% of available market capitalization.
The Nasdaq Composite Index measures all Nasdaq domestic and international-based common type stocks listed on The Nasdaq Stock Market. To be eligible for inclusion in the Index, the security’s U.S. listing must be exclusively on The Nasdaq Stock Market (unless the security was dually listed on another U.S. market prior to January 1, 2004 and has continuously maintained such listing). The security types eligible for the Index include common stocks, ordinary shares, ADRs, shares of beneficial interest or limited partnership interests and tracking stocks. Security types not included in the Index are closed-end funds, convertible debentures, exchange traded funds, preferred stocks, rights, warrants, units and other derivative securities.
The Dow Jones Industrial Average® (The Dow®), is a price-weighted measure of 30 U.S. blue-chip companies. The index covers all industries except transportation and utilities.
The MSCI EAFE Index is an equity index which captures large and mid-cap representation across 21 Developed Markets countries*around the world, excluding the US and Canada. With 902 constituents, the index covers approximately 85% of the free float-adjusted market capitalization in each country.
The MSCI Emerging Markets Index captures large and mid-cap representation across 26 Emerging Markets (EM) countries*. With 1,387 constituents, the index covers approximately 85% of the free float-adjusted market capitalization in each country.
Investment-grade Bond (or High-grade Bond) are believed to have a lower risk of default and receive higher ratings by the credit rating agencies. These bonds tend to be issued at lower yields than less creditworthy bonds.
Non-investment-grade debt securities (high-yield/junk bonds) may be subject to greater market fluctuations, risk of default or loss of income and principal than higher-rated securities.
Nasdaq-100® includes 100 of the largest domestic and international non-financial companies listed on the Nasdaq Stock Market based on market capitalization.
The Bloomberg Barclays U.S. Aggregate Bond Index is a broad-based benchmark that measures the investment grade, U.S. dollar-denominated, fixed-rate taxable bond market. This includes Treasuries, government-related and corporate securities, mortgage-backed securities, asset-backed securities, and collateralized mortgage-backed securities. ACA-2602-2.
