Developments over the Past Month:
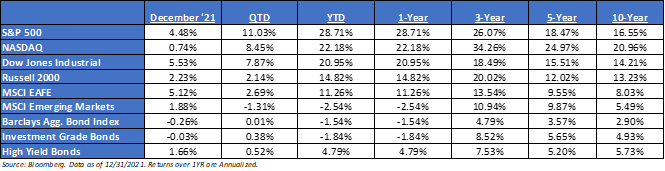
- Monthly Recap: Do you believe in Santa Claus? The market obviously did, as December, which tends to be a seasonally strong month, saw the S&P 500 rally 4.5%. With the S&P 500 finishing the year up 28.71%, 2021 ranked as the 21st best year for the index since 1926. It was also the 36th time that the total return was greater than 20%. With another year of superlatives, the market totaled 70 new all-time highs during the year – only trailing 1995 for most ever (77). Historically, when the number of new highs has been at elevated levels, the market has gone through a stretch in the following years of more new highs.
- Yearly Recap: The S&P 500 posted a total return of 28.71%, just slightly ahead of the Nasdaq and the Russell 1000 Growth Index, followed by the Russell 1000 Value Index. Bitcoin –perhaps the ultimate risk asset –soared by 60%. However, the Russell 2000 small cap benchmark and the High Yield credit index, both often viewed as a proxies for risk, returned just 14.82% and 4.79%, respectively. Defensive assets such as Investment-Grade bonds, US Treasuries, and Gold, all posted negative returns at -1.84%, -4.65%, and -3.55%, respectively
- Where Do We Stand? The path of least resistance has been higher in recent weeks, but there are a lot of moving pieces for the market to deal with – just look at the recent volatility. 1) Introduction of the Omicron variant 2) A potentially more hawkish Fed – Jerome Powell said that he would “consider” speeding up the pace of tapering and that it’s time to “retire” the word “transitory” when referring to inflation. Not to forget, the potential for increased political volatility – Congress did not pass the Build Back Better legislation in 2021, a mid-term election year.
- Equity Fundamentals: As equity valuations come under scrutiny amid the rapid rise in real rates, investor focus will increasingly assess whether earnings growth can continue to lead the market higher. We are focusing on Q4 2021 earnings, which will begin in early February. As of year-end, the consensus estimates expect S&P 500 EPS to increase +9% in 2022. We believe there is upside to consensus estimates but expect the frequency and magnitude of EPS beats will moderate from 1H 2022. There remain a few key risks to watch: (1) Supply chains, (2) oil, (3) labor costs, (4) Fed tapering cadence, (5) Omicron variant, and (6) China growth.
- The Fed Announced a Tapering Plan: As expected, the Federal Reserve officially announced the beginning of a tapering process to start last November at $15B/month. In December, Fed Chairman Jerome Powell announced that this cadence will double beginning in 2022 – ultimately concluding in late March ’22. This was somewhat expected by the market, as Fed Chair Powell continued to see strong economic data, alongside decade-high inflation readings. Even though the Fed increased their tapering cadence, they remain very dovish when it comes to interest rate hikes, i.e., liftoff. The market is currently pricing in three rate hikes next year and four in 2023.
- Earnings: 2021 S&P 500 operating earnings = $209. 2022 = $224. 2019 = $165. Bottoms-up for 2020 = $142 (low of $125 in June 2020).
- Valuations: S&P 500 Fwd. P/E is at 21.5x. EAFE is 14.7x forward P/E, while EM is at 11.9x. R1V is 15.7x v. R1G at 31.3x.
Talking Points – January 2022
- Though it wasn’t passed in 2021, President Biden outlined the biggest expansion of the federal government matched with the largest tax increase since 1968. Biden senses the post-COVID era is a once-in-a-generation opportunity to massively restructure US fiscal, monetary, and social policy. In our opinion, this is a big experiment. We’ll wait to see how the Build Back Better plan and taxes pan out. It appears that this dramatic change in societal direction has proved to be difficult for some moderate Democrats to get on board, i.e., Manchin.
- We have expected bond yields to reflate as the pandemic improves and economic activity begins to normalize. The spread on the 2s and 10s has historically expanded as wide as 300 bps (~84bps as of December month-end). This year’s peak was in March at ~160bps.
- With the recent Merck /Pfizer Therapeutic news, we believe that this should create an environment of increased optimism surrounding the resumption of normal economic activity, our expectation is that rates will continue to rise, and market leadership will shift away from Tech Growth into more downtrodden components of the market.
- This past year was led by a bunch of one-hit wonders, i.e., most likely not repeatable – a very dovish Fed, a successful economic reopening, and $8T of stimulus. None of which are expected to sustainably pump liquidity into the market next year. In 2022, the market may have to navigate a slew of negative headlines – increased taxes, higher-than-expected inflation, continued supply bottlenecks, and the possibility of more variants. All in all, we believe that this can create an environment of increased volatility.
- We feel it will be worth watching the general trend of economic and fundamental data, and when it will begin to decelerate.
- Longer-term, we believe valuations and bond yields will eventually matter, and both will lower expected returns for balanced portfolios.
Disclosures
Aptus Capital Advisors, LLC is a Registered Investment Advisor (RIA) registered with the Securities and Exchange Commission and is headquartered in Fairhope, Alabama. Registration does not imply a certain level of skill or training. For more information about our firm, or to receive a copy of our disclosure Form ADV and Privacy Policy call (251) 517-7198 or contact us here. Information presented on this site is for educational purposes only and does not intend to make an offer or solicitation for the sale or purchase of any securities.
This commentary offers generalized research, not personalized investment advice. It is for informational purposes only and does not constitute a complete description of our investment services or performance. Nothing in this commentary should be interpreted to state or imply that past results are an indication of future investment returns. All investments involve risk and unless otherwise stated, are not guaranteed. Be sure to consult with an investment & tax professional before implementing any investment strategy.
Past performance is not indicative of future results. This material is not financial advice or an offer to sell any product. The information contained herein should not be considered a recommendation to purchase or sell any particular security. Forward looking statements cannot be guaranteed.
The S&P 500® is widely regarded as the best single gauge of large-cap U.S. equities. There is over USD 11.2 trillion indexed or benchmarked to the index, with indexed assets comprising approximately USD 4.6 trillion of this total. The index includes 500 leading companies and covers approximately 80% of available market capitalization.
The Nasdaq Composite Index measures all Nasdaq domestic and international based common type stocks listed on The Nasdaq Stock Market. To be eligible for inclusion in the Index, the security’s U.S. listing must be exclusively on The Nasdaq Stock Market (unless the security was dually listed on another U.S. market prior to January 1, 2004 and has continuously maintained such listing). The security types eligible for the Index include common stocks, ordinary shares, ADRs, shares of beneficial interest or limited partnership interests and tracking stocks. Security types not included in the Index are closed-end funds, convertible debentures, exchange traded funds, preferred stocks, rights, warrants, units and other derivative securities.
The Dow Jones Industrial Average® (The Dow®), is a price-weighted measure of 30 U.S. blue-chip companies. The index covers all industries except transportation and utilities.
The Russell 2000® Index measures the performance of the small-cap segment of the US equity universe. The Russell 2000® Index is a subset of the Russell 3000® Index representing approximately 10% of the total market capitalization of that index. It includes approximately 2,000 of the smallest securities based on a combination of their market cap and current index membership. The Russell 2000® is constructed to provide a comprehensive and unbiased small-cap barometer and is completely reconstituted annually to ensure larger stocks do not distort the performance and characteristics of the true small-cap opportunity set.
The MSCI EAFE Index is an equity index which captures large and mid-cap representation across 21 Developed Markets countries*around the world, excluding the US and Canada. With 902 constituents, the index covers approximately 85% of the free float-adjusted market capitalization in each country.
The MSCI Emerging Markets Index captures large and mid-cap representation across 26 Emerging Markets (EM) countries*. With 1,387 constituents, the index covers approximately 85% of the free float-adjusted market capitalization in each country.
The Bloomberg Barclays U.S. Aggregate Bond Index is a broad-based benchmark that measures the investment grade, U.S. dollar-denominated, fixed-rate taxable bond market. This includes Treasuries, government-related and corporate securities, mortgage-backed securities, asset-backed securities and collateralized mortgage-backed securities. ACA-2201-1.
