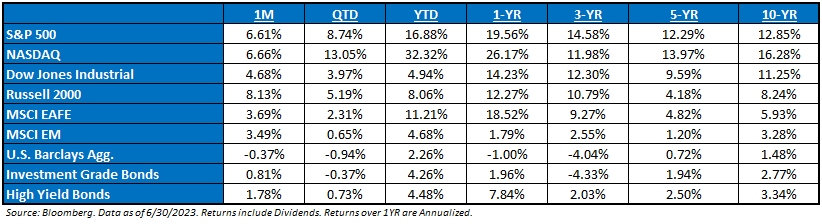
June ‘23 Market Recap: The banking fears of Q1 faded into an all-out Artificial Intelligence (“AI”) FOMO trade in Q2, as the S&P 500 returned 8.74%. Outside of AI, this quarter’s narrative was “Immaculate Disinflation”, which embodies falling inflation and stable growth, as well as a resilient consumer (strong labor market and spending). The big macro news out of the month was that the FOMC has communicated that they would like some insurance against inflation expectations becoming unanchored to the upside, as they are targeting two more hikes in ’23.
AI is Driving Sentiment: AI is expected to be the necessary growth and productivity narrative for an investing world that is in dire need of growth and productivity. AI promises both, and therefore investors compare this AI frenzy to the early days of the buildout of the Internet. The two major lessons of that analogy are 1) a lot can change over the first 10-15 years of a technology’s commercialization; picking long-term winners/losers is very difficult at this early stage (maintain flexibility). 2) The lasting equity value creation from a technological innovation can be far more impressive than near-term ebbs and flows (bubbles and crashes) in equities at the early phases of a technology’s commercialization.
Earnings Season: Though off of the highs forecasted roughly a year ago, ‘23 EPS estimates have turned up slightly, encouraging equity markets to trade higher. However, it seems that few institutional investors are buying into this reversing trend, choosing instead to camp out in the largest, most liquid, profitable names that have worked year-to-date. This is proving to further exacerbate the lack of market breadth.
Debt Ceiling Resolution: The Fiscal Responsibility Act (“FRA”) was approved by the President before the “X-Date”. This Act would raise the debt limit through January 1, 2025, and caps discretionary spending increases for six years – though the first two years are the only years that have enforceable spending caps. The market took the debt ceiling resolution in stride, as it includes fewer discretionary cuts than originally expected, i.e., growth may be more insulated in the future. Focus will now turn to the debt market, as US Treasury Secretary Janet Yellen, has started to successfully refill the Treasury General Account, which is basically known as the government’s checking account.
Investors Can Choose their Narrative on All Macro Data: Macro data is still mixed with no clear sign that a recession is imminent or that one can be avoided. The jobs picture, much like many different macro points, paints an environment in which you can pick your own narrative. For example, the household report showed that labor has slowed in the last few months after a resurgence. Of note, the household survey has witnessed job increases of a pedestrian 170k/month. The establishment survey suggests 5.2 million employed since March, and a “booming” labor market of ~370k/month over the same period. Investors have continued to see manufacturing PMIs be in contractionary territory, while services PMI remain in expansion. Macro is being held together by jobs, capex, and the consumer.
The Fed Update: The FOMC decided to “skip” a rate hike in the June meeting, but the dot plot was more hawkish than expected, with two rate hikes now being expected in ’23 (25bps signal was expected). But Powell largely downplayed these assumptions during the presser and the market-based peak Fed Funds rate didn’t move. The back end of the Fed Funds futures curve did shift up some, reflecting higher odds the Fed keep the rate at 5% or above for longer. Alongside the updated forecasts, FOMC participants took down forecasts for unemployment (to the left) and increased their inflation forecasts (to the right). The FOMC appears content to “cupid shuffle” to the terminal rate. Hikes in July and November is a reasonable base case now. The dance continues.
What Concerns Us the Most: In short: 1) Continued volatility; 2) Inflation transitions to growth frustration; 3) The potential for a Fed policy error and continued collateral damage; 4) A general tendency to think about the economy and stock prices in V-shaped terms, i.e., a Fed Pivot saving the day.
S&P Valuation: As the market rallied in June, the S&P 500 P/E is now above 20x on a forward 12-month basis, placing it in the statistically expensive category and is trading at a historical premium to every asset class except 10YR Treasury bonds (whose valuation it has been rapidly approaching). The S&P 500 premium converging with the bond premium is not a coincidence: the S&P 500 resembles a long-duration, low-coupon bond – its composition is dominated by mega-cap, long-term growth stocks that typically don’t pay dividends, but flourished during QE. Both asset classes will likely do well if real rates fall from here.
Earnings: ‘22 S&P 500 op. earnings = $219 (+7.4%). 2023 = $223 (+1.8%). 2021 = $204. 2020 = $136. 2019 = $161. *
Valuations: S&P 500 Fwd. P/E (NTM): 20.1x, EAFE: 13.7x, EM: 12.8x, R1V: 16.1x, R1G: 30.5x, and R2K: 16.0x.*
*Source: Bloomberg and FactSet, Data as of 06.30.2023
Disclosures
Aptus Capital Advisors, LLC is a Registered Investment Advisor (RIA) registered with the Securities and Exchange Commission and is headquartered in Fairhope, Alabama. Registration does not imply a certain level of skill or training. For more information about our firm, or to receive a copy of our disclosure Form ADV and Privacy Policy call (251) 517-7198 or contact us here. Information presented on this site is for educational purposes only and does not intend to make an offer or solicitation for the sale or purchase of any securities.
This commentary offers generalized research, not personalized investment advice. It is for informational purposes only and does not constitute a complete description of our investment services or performance. Nothing in this commentary should be interpreted to state or imply that past results are an indication of future investment returns. All investments involve risk and unless otherwise stated, are not guaranteed. Be sure to consult with an investment & tax professional before implementing any investment strategy.
Past performance is not indicative of future results. This material is not financial advice or an offer to sell any product. The information contained herein should not be considered a recommendation to purchase or sell any particular security. Forward looking statements cannot be guaranteed.
The S&P 500® is widely regarded as the best single gauge of large-cap U.S. equities. There is over USD 11.2 trillion indexed or benchmarked to the index, with indexed assets comprising approximately USD 4.6 trillion of this total. The index includes 500 leading companies and covers approximately 80% of
ADRs, shares of beneficial interest or limited partnership interests and tracking stocks. Security types not included in the Index are closed-end funds, convertible debentures, exchange traded funds, preferred stocks, rights, warrants, units, and other derivative securities.
The Dow Jones Industrial Average® (The Dow®), is a price-weighted measure of 30 U.S. blue-chip companies. The index covers all industries except transportation and utilities.
The Russell 2000® Index measures the performance of the small-cap segment of the US equity universe. The Russell 2000® Index is a subset of the Russell 3000® Index representing approximately 10% of the total market capitalization of that index. It includes approximately 2,000 of the smallest securities based on a combination of their market cap and current index membership. The Russell 2000® is constructed to provide a comprehensive and unbiased small-cap barometer and is completely reconstituted annually to ensure larger stocks do not distort the performance and characteristics of the true available market capitalization.
The Nasdaq Composite Index measures all Nasdaq domestic and international based common type stocks listed on The Nasdaq Stock Market. To be eligible for inclusion in the Index, the security’s U.S. listing must be exclusively on The Nasdaq Stock Market (unless the security was dually listed on another U.S. market prior to January 1, 2004, and has continuously maintained such listing). The security types eligible for the Index include common stocks, ordinary shares, small-cap opportunity set.
The MSCI EAFE Index is an equity index which captures large and mid-cap representation across 21 Developed Markets countries*around the world, excluding the US and Canada. With 902 constituents, the index covers approximately 85% of the free float-adjusted market capitalization in each country.
The MSCI Emerging Markets Index captures large and mid-cap representation across 26 Emerging Markets (EM) countries*. With 1,387 constituents, the index covers approximately 85% of the free float-adjusted market capitalization in each country.
Investment-grade Bond (or High-grade Bond) are believed to have a lower risk of default and receive higher ratings by the credit rating agencies. These bonds tend to be issued at lower yields than less creditworthy bonds.
Non-investment-grade debt securities (high-yield/junk bonds) may be subject to greater market fluctuations, risk of default or loss of income and principal than higher-rated securities.
The Bloomberg Barclays U.S. Aggregate Bond Index is a broad-based benchmark that measures the investment grade, U.S. dollar-denominated, fixed-rate taxable bond market. This includes Treasuries, government-related and corporate securities, mortgage-backed securities, asset-backed securities, and collateralized mortgage-backed securities.
ACA-2306-22.
