Developments over the Past Month:
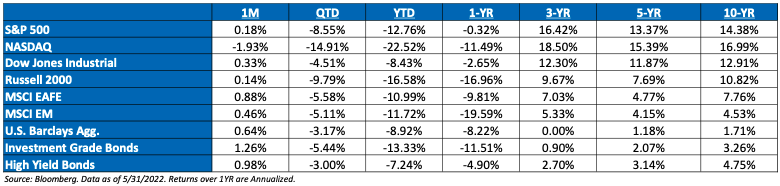
- The Beatings Will Continue Until Morale Improves: Markets wrapped up a volatile month of May exactly where it began. We started May at 4,131 on the S&P and ended May at 4132. Along the way we had 9 of the 21 trading days see 2% moves or more. The S&P was down 6% for the month on the 19th but was able to claw those losses back last week. The Dow Jones Industrials closed out the month up 0.04%. The Nasdaq Composite slipped 0.4% to end the month down 2.1%. The index had larger daily moves on about half of May’s trading days than its full-month performance.
- What is the Market Saying? – Both the Treasury and equity markets are clearly worried about the economic outlook. The only recent good news in the Treasury market is that inflation expectations have declined, but they still remain too high for comfort. Despite that, perceived inflation risk has increased. Expected growth has declined at all horizons but more so in the nearer term, and safe-haven flows indicate nervousness about the outlook. In the equity market, three- to five-years ahead earnings expectations have declined markedly and are well below trend, which in the past has been associated with serious economic slowdowns or recessions. Despite these concerning signs, a Fed reverse pivot does not appear close; the political environment is an important obstacle.
- How Far Can Stocks Rally? – Medium-term risks remain heavily tilted to the downside, in our view, but positioning, softer Fedspeak, and a history of vicious bear market rallies raise the risk of a continued near-term equity bounce. After all, not being close to the Fed put strike doesn’t mean markets are close to the (short) Fed call strike either, the point at which the Fed starts pushing back on equity strength to fight inflation.
- The Beginning of Quantitative Tightening – We are beginning a new regime as the Fed moves to reduce the size of its balance sheet which has grown to nearly $9 Trillion. Since March 2020, the Fed has made more than $4T in bond purchases. Now, to fight inflation, the Fed will begin to let some of their bonds mature (without replacing them). According to the central bank, roll offs will ramp up to $95 billion in September including a $60 billion reduction in U.S. Treasuries (“UST”) and a $35 billion reduction in Mortgage-Backed Securities (“MBS”). The first three months, however, will begin at half that pace, $47.5 billion, comprised of $30 billion UST and $17.5 billion MBS. That compares to a peak roll off $50 billion a month when the Fed performed the exercise starting back in 2017.
- Where is The Fed Put? – We continue to believe that the Fed Put is much lower right now, as FOMC Chairman Jerome Powell has stated that the Fed is going to keep raising until we have a recession unless inflation meaningfully improves. The cause of the decline is equally important. The Fed has a long history of easing policy in response to earnings drops, but there isn’t much evidence that it responds to multiple compression. The fact that inflation is higher than at any time since the genesis of the Fed Put and that stocks have appreciated a lot over the past two years suggest the strike is well below current prices. Similarly, the recent decline in stock prices owes exclusively to lower multiples; it would take another leg down induced by a drop in earnings to impress the Fed.
- Rate Hikes: The Fed is expected to hike another 50-bps hike in June, and now, the market is pricing in a 50 basis point hike in September. But after that the outlook is bit cloudier. The market has fully priced-in 10 rates hikes in 2022 (to the 2.50-2.75% range) and one more in 2023 which would be the fasted pace of hikes since 1989. We expect Powell’s tone to remain hawkish at future press conference. Finally, financial conditions have already tightened significantly, for example the pop in mortgage rates is harming housing affordability and with further Fed tightening there will be more casualties to slow the economy further.
- Earnings Highlights – Overall, 2022 consensus EPS are up modestly, but what is most noteworthy is how this earnings trend has skewed between indexes with small cap and value indexes seeing much more significant positive earnings revisions, while growth and larger cap indexes, more negative. While consensus 2022 EPS rose 1% since April 1, it was entirely driven by Energy (-0.2% ex-Energy). Over this past retail earnings season in middle May, we started to see a shift if spending habits by the consumer, spooking the market.
- Yield Curve Flattening & What It’s Telling Investors: The yield curve’s flattening is a sign of growing concern that the Fed is going to hike too much and break something. The curve inverted at the end of the last quarter, which would signal the market believes things are already breaking. As the short end of the curve rises, so too do the odds of rate hikes. The market is now pricing in a 50 basis point rate hike in Sep.
- Earnings: 2022 S&P 500 operating earnings = $223. 2023 = $235. 2021 = $209. 2020 = $142. 2019 = $165.
- Valuations: S&P 500 Fwd. P/E: 18.0x, EAFE: 12.7x, EM: 11.2x, R1V: 14.6x, R1G: 23.3x, and R2K: 12.1x.
Client Talking Points – June 2022
- Yield Curve: The yield curve officially inverted at the end of March. An inversion of the 10/2 spread does not mean a recession is imminent. Historically speaking, stocks rally for about a year after a 10s-2s inversion, with an average return around 15% (heads up, this is a different range than shown in a below chart). So, a curve inversion is not a reason to sell—it’s a signal that the time on the bull market and economic expansion is now limited, and to prepare for both to end.
- Build Back Better: Though it wasn’t passed in 2021, President Biden outlined the biggest expansion of the federal government matched with the largest tax increase since 1968. Biden senses the post-COVID era is a once-in-a-generation opportunity to massively restructure US fiscal, monetary, and social policy. In our opinion, this is a big experiment. We’ll wait to see how the Build Back Better plan and taxes pan out. It appears that this dramatic change in societal direction has proved to be difficult for some moderate Democrats to get on board, i.e., Manchin.
- We continue to watch forward EPS expectations fort he market as it starts to grapple with higher-than-expected inflation curtailing margins.
- Longer-term, we believe valuations and bond yields will eventually matter, and both will lower expected returns for balanced portfolios.
Disclosures:
Aptus Capital Advisors, LLC is a Registered Investment Advisor (RIA) registered with the Securities and Exchange Commission and is headquartered in Fairhope, Alabama. Registration does not imply a certain level of skill or training. For more information about our firm, or to receive a copy of our disclosure Form ADV and Privacy Policy call (251) 517-7198 or contact us here. Information presented on this site is for educational purposes only and does not intend to make an offer or solicitation for the sale or purchase of any securities.
This commentary offers generalized research, not personalized investment advice. It is for informational purposes only and does not constitute a complete description of our investment services or performance. Nothing in this commentary should be interpreted to state or imply that past results are an indication of future investment returns. All investments involve risk and unless otherwise stated, are not guaranteed. Be sure to consult with an investment & tax professional before implementing any investment strategy.
Past performance is not indicative of future results. This material is not financial advice or an offer to sell any product. The information contained herein should not be considered a recommendation to purchase or sell any particular security. Forward looking statements cannot be guaranteed.
The S&P 500® is widely regarded as the best single gauge of large-cap U.S. equities. There is over USD 11.2 trillion indexed or benchmarked to the index, with indexed assets comprising approximately USD 4.6 trillion of this total. The index includes 500 leading companies and covers approximately 80% of available market capitalization.
The Nasdaq Composite Index measures all Nasdaq domestic and international based common type stocks listed on The Nasdaq Stock Market. To be eligible for inclusion in the Index, the security’s U.S. listing must be exclusively on The Nasdaq Stock Market (unless the security was dually listed on another U.S. market prior to January 1, 2004 and has continuously maintained such listing). The security types eligible for the Index include common stocks, ordinary shares, ADRs, shares of beneficial interest or limited partnership interests and tracking stocks. Security types not included in the Index are closed-end funds, convertible debentures, exchange traded funds, preferred stocks, rights, warrants, units and other derivative securities.
The Dow Jones Industrial Average® (The Dow®), is a price-weighted measure of 30 U.S. blue-chip companies. The index covers all industries except transportation and utilities.
The Russell 2000® Index measures the performance of the small-cap segment of the US equity universe. The Russell 2000® Index is a subset of the Russell 3000® Index representing approximately 10% of the total market capitalization of that index. It includes approximately 2,000 of the smallest securities based on a combination of their market cap and current index membership. The Russell 2000® is constructed to provide a comprehensive and unbiased small-cap barometer and is completely reconstituted annually to ensure larger stocks do not distort the performance and characteristics of the true small-cap opportunity set.
The MSCI EAFE Index is an equity index which captures large and mid-cap representation across 21 Developed Markets countries*around the world, excluding the US and Canada. With 902 constituents, the index covers approximately 85% of the free float-adjusted market capitalization in each country.
The MSCI Emerging Markets Index captures large and mid-cap representation across 26 Emerging Markets (EM) countries*. With 1,387 constituents, the index covers approximately 85% of the free float-adjusted market capitalization in each country.
Investment-grade Bond (or High-grade Bond) are believed to have a lower risk of default and receive higher ratings by the credit rating agencies. These bonds tend to be issued at lower yields than less creditworthy bonds.
Non-investment-grade debt securities (high-yield/junk bonds) may be subject to greater market fluctuations, risk of default or loss of income and principal than higher-rated securities.
The Bloomberg Barclays U.S. Aggregate Bond Index is a broad-based benchmark that measures the investment grade, U.S. dollar-denominated, fixed-rate taxable bond market. This includes Treasuries, government-related and corporate securities, mortgage-backed securities, asset-backed securities and collateralized mortgage-backed securities. ACA-2206-5.
