May ‘24 Market Recap – In Like a Lion, Out Like a Lamb: After April came in with showers, May came out like a lamb, driven by a better-than-anticipated earnings season, leading the market higher by nearly 5.0%. In fact, the market hit two new all-time highs during the month. When the S&P returns >10% through May, the market tends to continue to move higher for the remainder of the year, with a 90% hit rate.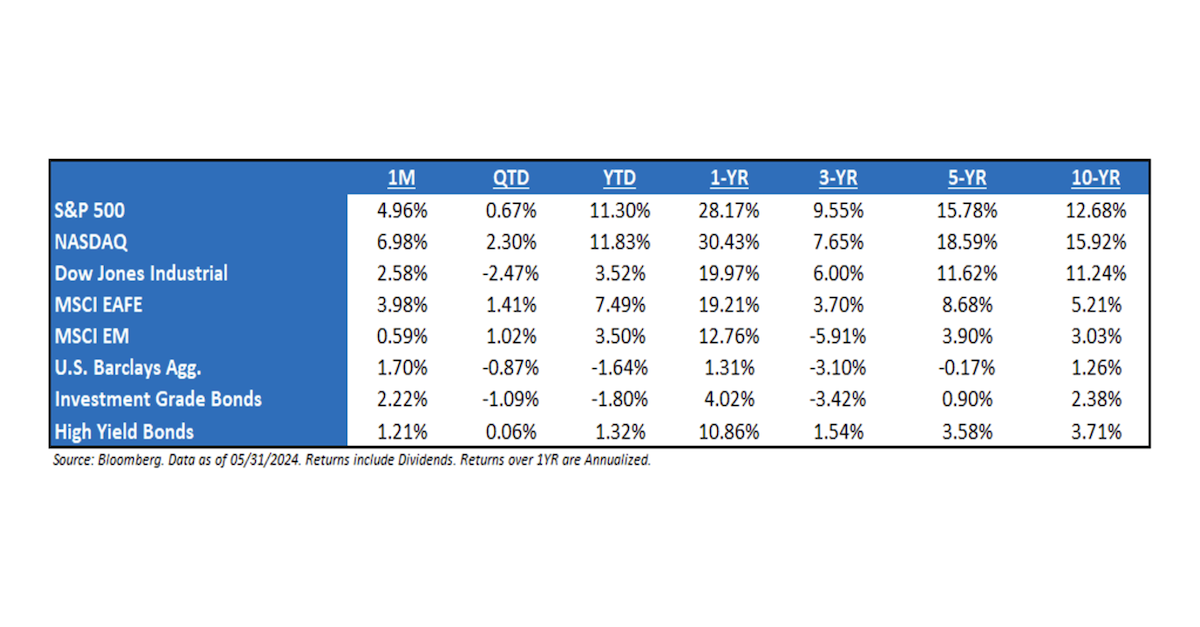 Moving Forward, It’s All About Growth: Inflation around 3% isn’t a threat to the market or economy by itself, but the Fed’s response to that sticky inflation could be to keep rates “higher for longer” and the impact of that will be increased chances for an economic slowdown—which remains a real risk to this rally. Bottom line, focus on growth. Growth is the rally killer.
What Did Earnings Say about the Consumer? Employment and spending data have remained healthy, with the economy adding 175k jobs in April, personal income and spending increasing in March, and consumer balance sheets remaining in good shape. Nevertheless, consumer confidence has struggled to recover back to pre-COVID levels, and the most recent reading dropped to the lowest level since July 2022. More recently, it’s been all about elevated gas prices and higher interest rates as contributors to soft consumer confidence, and we note that there have been signs of shifts to more value-oriented products. Across S&P 500 firms, those within the Financials sector that have a higher-level view of consumer have noted that they still see strength in consumer spending and consumer balance sheets. Among consumer-facing companies however, the tone is more cautious, with several companies noting that the consumer has become more discerning and have started to trade down to lower-priced product offerings.
Consumer Continued: There’s about ~$5 trillion in retail savings/money market accounts in the US. Just two years ago, these were earning zero percent. With higher rates, they are now pouring ~$250 billion annually into the pockets of generally high income/high net worth consumers. So as the low end continues to struggle, the high end has had an offset to higher rates. But we are now lapping peak rates, so YoY, there is no longer an incremental ~$250mm YoY entering the economy from higher interest income (we’re lapping it). We’re not sure if it matters or whether this will mean more of the rate hikes will show up in slowing at the macro level, but it’s clearly been one of the reasons the economy has been more resilient than typical to higher rates. By the way, that’s ~1.5% of consumer spending annually.
The Fed Wasn’t Wrong → Market Consensus Was Wrong: In the last 2 months of 2023, the market added an additional percentage point of rate cuts to its year-end 2024 expectation, taking the total quantity of expected quarter-point rate cuts to seven. Looking back, most consensus forecasters pointed to Jay’s “dovish pivot”, and the new FOMC December dot plot calling for one additional 2024 cut, as the primary drivers for this heightened exuberance on rates. Fast-forward through the first five months of 2024 and all of those extra cuts have been wiped out from market expectations, plus a little bit more. The reset caused the market to post its first decline (albeit modest) in April in six months yet rebounded after earnings in May. Over the past few years, consensus continues to be wrong.
Macro → Nothing Changes Until Something Changes: Recent Fed speak and the May FOMC minutes make it clear that the upside inflation surprises this year, coupled with solid activity, are likely to take rate cuts off the table for now. There also seems to be strong consensus that policy is in restrictive territory, and so hikes are probably not necessary either. Looking ahead, rate cuts could be triggered by either slowing inflation or a sharp deterioration in activity. By contrast, hikes would likely only come into play if inflation (or inflation expectations) increased considerably.
The Presidential Election Year: Since ‘52, the S&P 500 has not declined in a year in which an incumbent president was running for re-election (avg. return of 10%). Stocks have declined in presidential election years, but in each of those cases, it was a year in which there was an open election with no incumbent running (‘60, ‘00, and ‘08). Presidents want to be re-elected and will use whatever policy levers are needed to boost the US economy. In fact, every president who avoided a recession two years before their re-election went on to win the election. And every president who had a recession in the two years before their re-election went on to lose.
S&P 500 EPS: ’25 (Exp.) EPS = $277. ‘24 EPS = $244 (+10.7%). 2023 = $220 (+0.5%). 2022 = $219 (+7.4%). 2021 = $204.*
Valuations: S&P 500 Fwd. P/E (NTM): 20.7x, EAFE: 14.6x, EM: 11.9x, R1V: 16.0x, and R1G: 26.7x. *
*Source: Bloomberg and FactSet, Data as of 05/31/24
Disclosures
Aptus Capital Advisors, LLC is a Registered Investment Advisor (RIA) registered with the Securities and Exchange Commission and is headquartered in Fairhope, Alabama. Registration does not imply a certain level of skill or training. For more information about our firm, or to receive a copy of our disclosure Form ADV and Privacy Policy call (251) 517-7198 or contact us here. Information presented on this site is for educational purposes only and does not intend to make an offer or solicitation for the sale or purchase of any securities.
This commentary offers generalized research, not personalized investment advice. It is for informational purposes only and does not constitute a complete description of our investment services or performance. Nothing in this commentary should be interpreted to state or imply that past results are an indication of future investment returns. All investments involve risk and unless otherwise stated, are not guaranteed. Be sure to consult with an investment & tax professional before implementing any investment strategy.
Past performance is not indicative of future results. This material is not financial advice or an offer to sell any product. The information contained herein should not be considered a recommendation to purchase or sell any particular security. Forward looking statements cannot be guaranteed.
The S&P 500® is widely regarded as the best single gauge of large-cap U.S. equities. There is over USD 11.2 trillion indexed or benchmarked to the index, with indexed assets comprising approximately USD 4.6 trillion of this total. The index includes 500 leading companies and covers approximately 80% of available market capitalization.
The Nasdaq Composite Index measures all Nasdaq domestic and international based common type stocks listed on The Nasdaq Stock Market. To be eligible for inclusion in the Index, the security’s U.S. listing must be exclusively on The Nasdaq Stock Market (unless the security was dually listed on another U.S. market prior to January 1, 2004 and has continuously maintained such listing). The security types eligible for the Index include common stocks, ordinary shares, ADRs, shares of beneficial interest or limited partnership interests and tracking stocks. Security types not included in the Index are closed-end funds, convertible debentures, exchange traded funds, preferred stocks, rights, warrants, units and other derivative securities.
The Dow Jones Industrial Average® (The Dow®), is a price-weighted measure of 30 U.S. blue-chip companies. The index covers all industries except transportation and utilities.
The MSCI EAFE Index is an equity index which captures large and mid-cap representation across 21 Developed Markets countries*around the world, excluding the US and Canada. With 902 constituents, the index covers approximately 85% of the free float-adjusted market capitalization in each country.
The MSCI Emerging Markets Index captures large and mid-cap representation across 26 Emerging Markets (EM) countries*. With 1,387 constituents, the index covers approximately 85% of the free float-adjusted market capitalization in each country.
Investment-grade Bond (or High-grade Bond) are believed to have a lower risk of default and receive higher ratings by the credit rating agencies. These bonds tend to be issued at lower yields than less creditworthy bonds.
Non-investment-grade debt securities (high-yield/junk bonds) may be subject to greater market fluctuations, risk of default or loss of income and principal than higher-rated securities.
The Bloomberg Barclays U.S. Aggregate Bond Index is a broad-based benchmark that measures the investment grade, U.S. dollar-denominated, fixed-rate taxable bond market. This includes Treasuries, government-related and corporate securities, mortgage-backed securities, asset-backed securities, and collateralized mortgage-backed securities. ACA-2406-4.
