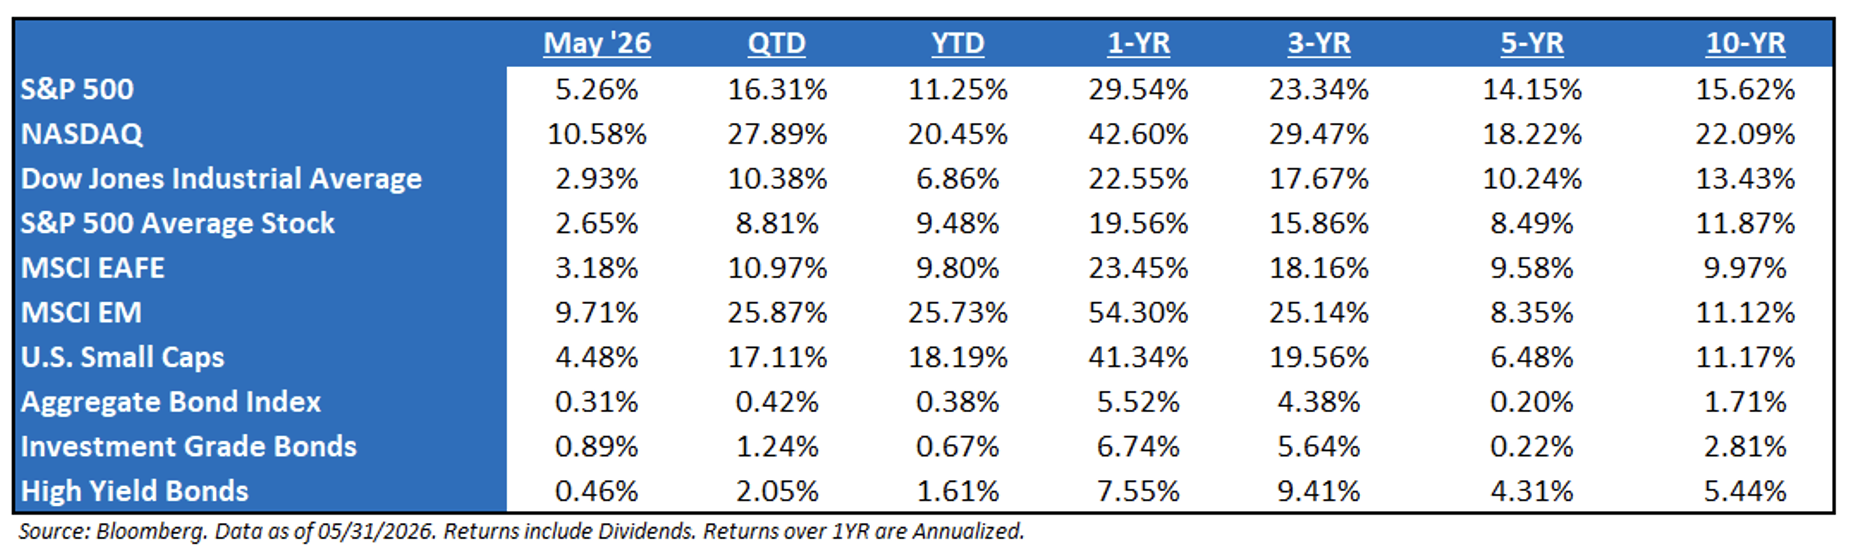
Tech Gains and AI Optimism Defy Seasonal Slumps in May: The global financial markets put on a resilient performance, shunning the traditional “Sell in May and go away” seasonal slump to book notable gains. The rally was heavily powered by blockbuster first-quarter corporate earnings – especially within the technology sector – where AI-driven optimism pushed the S&P 500 up roughly 5.3% to record milestones. While international equities in Europe and Japan posted steady gains, Emerging Markets stole the spotlight with near double-digit returns driven by massive tech supply-chain demand in South Korea and Taiwan. However, this equity triumph was balanced by a reality check in the fixed-income and commodity spaces; persistent inflationary pressures and steady labor data forced bond yields higher as the Federal Reserve weighed a more hawkish path, while commodities finished the month lower as cooling energy prices pulled crude oil back below the $100-a-barrel mark.
What’s on the Mind of the Fed? In the words of the previous Fed Chairman, Jerome Powell, it’s likely that the Fed needs to “start thinking about…thinking about raising rates”. Given the strength in the economy and the Fed’s notion to let it run “hot”, it seems like the easing bias in the market needs to go away. Moreso, the market is now trying to figure out if high-flying tech valuations can withstand a “higher-for-longer” (or even higher-than-now) interest rate environment. If benchmark 10-year Treasury yields stay firmly above 4.5%, which has historically been a level where equities felt a little price pain, it puts immense pressure on stocks, forcing a rotation out of growth sectors and into defensive, income-generating assets. The market’s cutting bias needs to be put to rest.
Why Has the Market Remained So Resilient? Three separate forms of economic stimuli are hitting the economy and markets: Combining these factors increases expectations for economic growth and corporate earnings sustainability.
Monetary stimulus: In September, the Fed cut rates, but more importantly, signaled that a rate-cutting cycle had started. That matters because it means monetary stimulus is now occurring, which is positive for the economy and, peripherally, risk assets. It tends to take 12 – 16 months for rate cuts to flow into the economy.
Fiscal stimulus is occurring via the passage of the “One Big Beautiful Bill”, which solidified and boosted tax cuts, as well as unleashed billions in Federal dollars across various industries.
Private stimulus, meanwhile, is occurring through massive AI-linked capital expenditures from major tech companies such as META, MSFT, AMZN, ORCL, and others (remember, these mega-cap tech firms could spend more than $700 billion on AI infrastructure in 2027).
Earnings Recap Q1 2026:There’s been an absolute “boom” in earnings for Q1 2026:
-
- “Boom” in EPS beats: 85% of S&P 500 firms beating EPS – the best hit rate in 5 years
-
- “Boom” in Margins: 64% of sectors have seen margin expansion over the past three months
-
- “Boom” in Growth: 73% of sectors are now expected to post double-digit EPS growth
-
- “Boom” in Momentum: Forward EPS expectations are up by 8%, revenues up by 4%
-
- “Booming” AI demand: Hyperscalers saw EPS and revenue beats
Large, mid, and small cap indices are on pace now for 15%+ year-over-year (“YoY”) earnings growth, which is generally typical only in early stages of economic recoveries; however, in this case, we believe it is consistent with a Fed willing to let the nominal economy “run hot” so far. It feels like the risk in the economy is much more on the “run-hot” side of the ledger than a recession.
Bull Markets Last Longer than Investors Think: It’s likely too early to cleverly call a market top, stating that the bull market is over. In fact, looking at the 11 bull markets since World War II, the average one lasts more than five years. Not only that, the current bull market is up a very impressive 123% since October ‘22 – which sounds like a lot – but in the context of historical rallies (the avg. bull market is +191%), perspective may state that the bull market is younger than many would think.
Aptus’ Phrase of the Year – What to Focus on Right Now: When markets feel like they’re chaotic, remember to focus on the basics, i.e., economic growth.
Profit Growth Continues to Trend Higher – With Q1 earnings season in the rear view, the fundamental backdrop for equities remains supportive as investors navigate a mid-term election year. As of the end of May, the next twelve-month earnings growth stands at 21%. If there’s one area of fundamental risk, it’s the continued concentration within the index – it can drive markets higher or lower. The top 10 companies now account for about one-third of total net income, meaning a miss from any major large-cap contributors could materially affect the overall earnings outlook. For now, though, growth remains robust due to the strong operating leverage of the index.
Understanding the 2026 Narrative – Today’s narrative largely centers on two themes: continued AI-related capital expenditures, albeit at a slower pace, and the potential for an economic reacceleration supported by fiscal stimulus and Federal Reserve policy. While AI Capex growth will naturally moderate after such outsized investment levels, a key question is whether companies that issue debt to fund this spending will continue to receive the same valuation multiples they enjoyed earlier in the cycle. As for the prospect of an economic reacceleration, the question now is whether consumer momentum can be sustained through year-end before the fiscal stimulus starts to take effect in 2026.
S&P 500 EPS: ’27 (Exp.) EPS = $391.08 (+15.7%). ’26 (Exp.) EPS = $338.16 (+23.2%). ’25 (Exp.) EPS = $274.54 (+12.0%). ‘24 EPS = $245.16 (+11.5%).
Valuations:S&P 500 Fwd. P/E (NTM): 21.1x, NASDAQ: 24.8x, EAFE: 15.9x, EM: 12.0x, R1V: 17.2x, and R1G: 26.2x. *
*Source: Bloomberg and FactSet, Data as of 05/31/26
Disclosures
Aptus Capital Advisors, LLC is a Registered Investment Advisor (RIA) registered with the Securities and Exchange Commission and is headquartered in Fairhope, Alabama. Registration does not imply a certain level of skill or training. For more information about our firm, or to receive a copy of our disclosure Form ADV and Privacy Policy call (251) 517-7198 or contact us here. Information presented on this site is for educational purposes only and does not intend to make an offer or solicitation for the sale or purchase of any securities.
This commentary offers generalized research, not personalized investment advice. It is for informational purposes only and does not constitute a complete description of our investment services or performance. Nothing in this commentary should be interpreted to state or imply that past results are an indication of future investment returns. All investments involve risk and unless otherwise stated, are not guaranteed. Be sure to consult with an investment & tax professional before implementing any investment strategy.
Past performance is not indicative of future results. This material is not financial advice or an offer to sell any product. The information contained herein should not be considered a recommendation to purchase or sell any particular security. Forward looking statements cannot be guaranteed.
The S&P 500® is widely regarded as the best single gauge of large-cap U.S. equities. There is over USD 11.2 trillion indexed or benchmarked to the index, with indexed assets comprising approximately USD 4.6 trillion of this total. The index includes 500 leading companies and covers approximately 80% of available market capitalization.
The Nasdaq Composite Index measures all Nasdaq domestic and international based common type stocks listed on The Nasdaq Stock Market. To be eligible for inclusion in the Index, the security’s U.S. listing must be exclusively on The Nasdaq Stock Market (unless the security was dually listed on another U.S. market prior to January 1, 2004 and has continuously maintained such listing). The security types eligible for the Index include common stocks, ordinary shares, ADRs, shares of beneficial interest or limited partnership interests and tracking stocks. Security types not included in the Index are closed-end funds, convertible debentures, exchange traded funds, preferred stocks, rights, warrants, units and other derivative securities.
The Dow Jones Industrial Average® (The Dow®), is a price-weighted measure of 30 U.S. blue-chip companies. The index covers all industries except transportation and utilities.
The MSCI EAFE Index is an equity index which captures large and mid-cap representation across 21 Developed Markets countries*around the world, excluding the US and Canada. With 902 constituents, the index covers approximately 85% of the free float-adjusted market capitalization in each country.
The MSCI Emerging Markets Index captures large and mid-cap representation across 26 Emerging Markets (EM) countries*. With 1,387 constituents, the index covers approximately 85% of the free float-adjusted market capitalization in each country.
Investment-grade Bond (or High-grade Bond) are believed to have a lower risk of default and receive higher ratings by the credit rating agencies. These bonds tend to be issued at lower yields than less creditworthy bonds.
Non-investment-grade debt securities (high-yield/junk bonds) may be subject to greater market fluctuations, risk of default or loss of income and principal than higher-rated securities.
Nasdaq-100® includes 100 of the largest domestic and international non-financial companies listed on the Nasdaq Stock Market based on market capitalization.
The Bloomberg Barclays U.S. Aggregate Bond Index is a broad-based benchmark that measures the investment grade, U.S. dollar-denominated, fixed-rate taxable bond market. This includes Treasuries, government-related and corporate securities, mortgage-backed securities, asset-backed securities, and collateralized mortgage-backed securities. ACA-2606-8.
