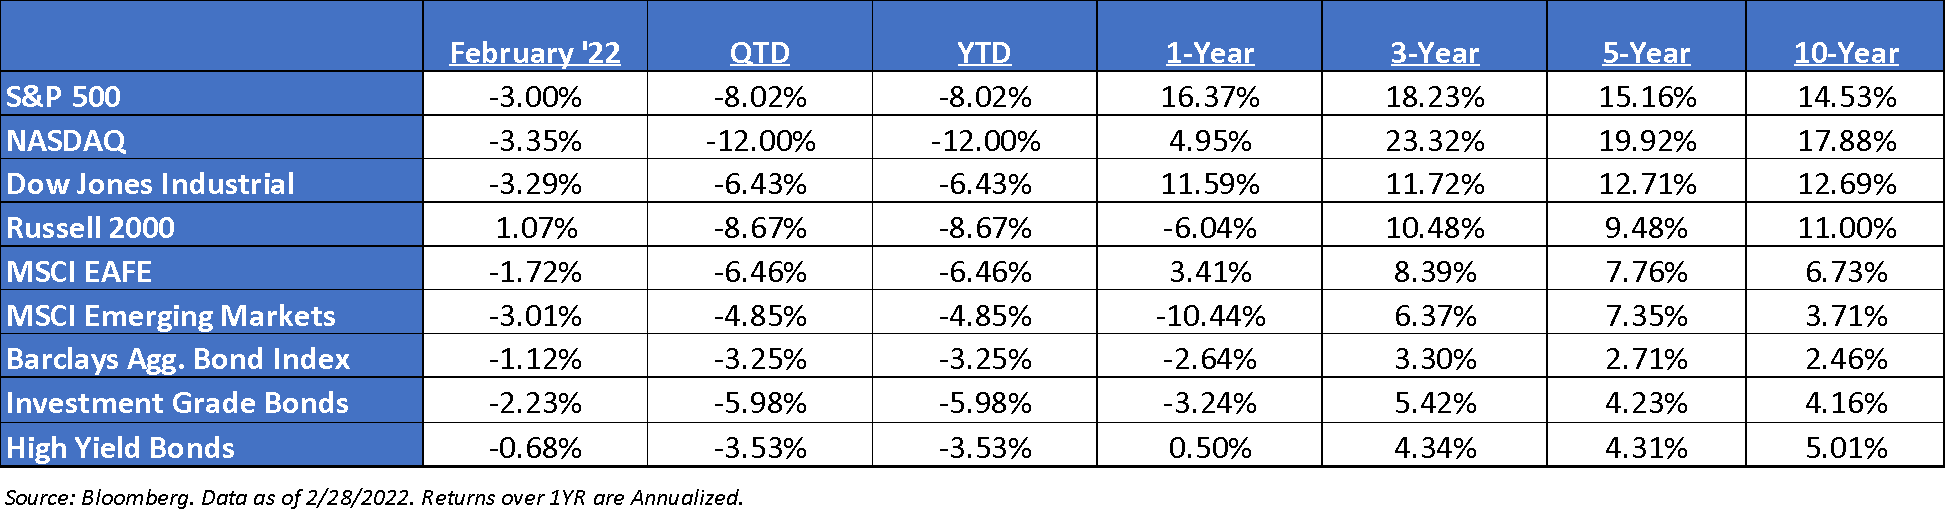
The market, measured by the S&P 500, officially entered a “correction” phase, as investors continue to disseminate the latest news on the Russia/Ukraine front. Markets have been attempting to price in worst case scenarios as it pertains to Russia and Ukraine over the last several weeks. While there has been significant multiple contraction and risk off action over that time frame. One of the hardest things to do when faced with a major global event – whether it’s weather: e.g., hurricanes, floods, tornadoes, etc., or a military conflict, as we are facing today – is to separate the emotional response from the economic implications. Through February the S&P finds itself off a little more than -8% for the year – since 1950, only 2020 (-9%), 2009 (-19%), 2008 (-9%), and 1978 (-9%) have been worse.
February Notables
Russia/Ukraine Geopolitical Volatility
While tensions between Russia and Ukraine have been rising for years, the current military action is creating concerns about the potential impact on financial markets and the global economy. Fortunately, however, history shows that while geopolitical crises such as the one between Russia and Ukraine can temporarily roil markets, they don’t typically have long-term consequences for investors. In general, these types of crises tend to only have a significant and lasting impact on global financial markets if they have a sustained macroeconomic impact on major economies. While Russia’s economy ranks as the world’s 11th largest, according to the IMF, at only 1/20th the size of the US and 1/15th the size of China, it is likely not big enough by itself to affect global markets or economic growth, even if it were to suffer significant economic damage as a result of sanctions or other measures taken against it by the US and Europe.
Equity Fundamentals are Normalizing
As equity valuations come under scrutiny amid the rapid rise in real rates, investor focus will increasingly assess whether earnings growth can continue to lead the market higher. The fourth quarter reporting season wrapped up at the end of February for the S&P 500 and all things considered, we believe it turned out to be a strong quarter. Earnings growth came in north of 30% and revenue growth approached 15%. 2022 is going to be a much different strong as companies deal with various macro events.
Bonds Not Hedging Stocks
Fixed Income has offered no hedge to the equity drawdown this year. This was the first ever market correction in the QE regime where bond yields have gone up, not down. There’s been 6 major drawdowns over the last 13 years, in every one of them, yields have roughly declined by 100bps on average during the drawdown – that has not been the case this time.
The Fed Update
Russia’s invasion of Ukraine has injected new uncertainty into the economic outlook but is unlikely to derail the Federal Reserve’s plans to begin raising interest rates from March, as it seeks to combat the highest inflation in 40 years…the first rate rise is only expected to be a quarter of a percentage point as opposed to a supersized half-point increase as some have speculated, given concerns about how Russia’s assault on Ukraine could temper economic growth, and earlier resistance from many Fed officials…There are concerns about the Fed moving too gradually.
Rate Hikes
Market participants are pricing in the potential for as many as seven rate hikes by the Federal reserve this year, with some looking for the first hike in March to be 50 basis points – this would be the first rate hike above 25bps since May 2000. We continue to think that the hawkish estimates will prove to be overblown. The current Federal Reserve has been both hyper transparent, and steadfastly deliberate in their actions. The potential for them to do anything that surprises the markets seems unlikely.
Yield Curve Flattening & What It’s Telling Investors
The yield curve’s flattening is a sign of growing concern that the Fed is going to hike too much and break something. The curve is not yet inverted, which would signal the market believes things are already breaking, but it is rapidly moving toward that level. As the short end of the curve rises, so too do the odds of rate hikes. The market has seven (7) rate hikes priced in by the end of 2022. The market still sees the terminal rate settling in around 1.75% or 2.00%.
Earnings
2021 S&P 500 operating earnings = $209. 2022 = $225. 2019 = $165. Bottoms-up for 2020 = $142.
Valuations
S&P 500 Fwd. P/E is at 19.3x. EAFE is 13.7x forward P/E, while EM is at 11.4x. Russell 1000 Value is 15.3x v. Russell 1000 Growth at 25.4x.
Talking Points – March 2022
- We have expected bond yields to reflate as the pandemic improves and economic activity begins to normalize. The spread on the 2s and 10s has historically expanded as wide as 300 bps (~41bps as of February month-end). Last year’s peak was in March 2021 at ~160bps. Real Rates have never been negative outside some sort of Quantitative Easing environment.
- Though it wasn’t passed in 2021, President Biden outlined the biggest expansion of the federal government matched with the largest tax increase since 1968. Biden senses the post-COVID era is a once-in-a-generation opportunity to massively restructure US fiscal, monetary, and social policy. In our opinion, this is a big experiment. We’ll wait to see how the Build Back Better plan and taxes pan out. It appears that this dramatic change in societal direction has proved to be difficult for some moderate Democrats to get on board, i.e., Manchin.
- This past year was led by a bunch of one-hit wonders, i.e., most likely not repeatable – a very dovish Fed, a successful economic reopening, and $8T of stimulus. None of which are expected to sustainably pump liquidity into the market next year. In 2022, the market may have to navigate a slew of negative headlines – increased taxes, higher-than-expected inflation, continued supply bottlenecks, and the possibility of more variants. All in all, we believe that this can create an environment of increased volatility.
- We feel it will be worth watching the general trend of economic and fundamental data, and when it will begin to decelerate.
- Longer-term, we believe valuations and bond yields will eventually matter, and both will lower expected returns for balanced portfolios.
Disclosures
Aptus Capital Advisors, LLC is a Registered Investment Advisor (RIA) registered with the Securities and Exchange Commission and is headquartered in Fairhope, Alabama. Registration does not imply a certain level of skill or training. For more information about our firm, or to receive a copy of our disclosure Form ADV and Privacy Policy call (251) 517-7198 or contact us here. Information presented on this site is for educational purposes only and does not intend to make an offer or solicitation for the sale or purchase of any securities.
This commentary offers generalized research, not personalized investment advice. It is for informational purposes only and does not constitute a complete description of our investment services or performance. Nothing in this commentary should be interpreted to state or imply that past results are an indication of future investment returns. All investments involve risk and unless otherwise stated, are not guaranteed. Be sure to consult with an investment & tax professional before implementing any investment strategy.
Past performance is not indicative of future results. This material is not financial advice or an offer to sell any product. The information contained herein should not be considered a recommendation to purchase or sell any particular security. Forward looking statements cannot be guaranteed.
The S&P 500® is widely regarded as the best single gauge of large-cap U.S. equities. There is over USD 11.2 trillion indexed or benchmarked to the index, with indexed assets comprising approximately USD 4.6 trillion of this total. The index includes 500 leading companies and covers approximately 80% of available market capitalization.
The Nasdaq Composite Index measures all Nasdaq domestic and international based common type stocks listed on The Nasdaq Stock Market. To be eligible for inclusion in the Index, the security’s U.S. listing must be exclusively on The Nasdaq Stock Market (unless the security was dually listed on another U.S. market prior to January 1, 2004 and has continuously maintained such listing). The security types eligible for the Index include common stocks, ordinary shares, ADRs, shares of beneficial interest or limited partnership interests and tracking stocks. Security types not included in the Index are closed-end funds, convertible debentures, exchange traded funds, preferred stocks, rights, warrants, units and other derivative securities.
The Dow Jones Industrial Average® (The Dow®), is a price-weighted measure of 30 U.S. blue-chip companies. The index covers all industries except transportation and utilities.
The Russell 2000® Index measures the performance of the small-cap segment of the US equity universe. The Russell 2000® Index is a subset of the Russell 3000® Index representing approximately 10% of the total market capitalization of that index. It includes approximately 2,000 of the smallest securities based on a combination of their market cap and current index membership. The Russell 2000® is constructed to provide a comprehensive and unbiased small-cap barometer and is completely reconstituted annually to ensure larger stocks do not distort the performance and characteristics of the true small-cap opportunity set.
The MSCI EAFE Index is an equity index which captures large and mid-cap representation across 21 Developed Markets countries*around the world, excluding the US and Canada. With 902 constituents, the index covers approximately 85% of the free float-adjusted market capitalization in each country.
The MSCI Emerging Markets Index captures large and mid-cap representation across 26 Emerging Markets (EM) countries*. With 1,387 constituents, the index covers approximately 85% of the free float-adjusted market capitalization in each country.
Investment-grade Bond (or High-grade Bond) are believed to have a lower risk of default and receive higher ratings by the credit rating agencies. These bonds tend to be issued at lower yields than less creditworthy bonds.
Non-investment-grade debt securities (high-yield/junk bonds) may be subject to greater market fluctuations, risk of default or loss of income and principal than higher-rated securities.
Nasdaq-100® includes 100 of the largest domestic and international non-financial companies listed on the Nasdaq Stock Market based on market capitalization.
The Bloomberg Barclays U.S. Aggregate Bond Index is a broad-based benchmark that measures the investment grade, U.S. dollar-denominated, fixed-rate taxable bond market. This includes Treasuries, government-related and corporate securities, mortgage-backed securities, asset-backed securities and collateralized mortgage-backed securities. ACA-2203-2.
