February ‘24 Market Recap: Helped by better-than-expected earnings, the S&P 500 (+5.3% total return) clocked a fresh high in Feb. But just 26% of stocks outperformed the index, similar to recent months, and 45% of the index’s gain came from four stocks: Nvidia (contributing 1.1%), Meta (0.6%), Amazon (0.5%) and Microsoft (0.3%). US equities outperformed other asset classes including bonds (L/T Treasury Bonds -2.3%, IG corp. bonds -1.4%), cash (3m T-Bill +0.4%), gold (-1.4%) and ex-US equities (+3.5% in local terms / +2.5% in USD). Despite new S&P highs, we believe that current sentiment is not yet euphoric.
 What Has Been Working: Since 2023, U.S. stocks have handily outperformed stocks around the rest of the world. The MSCI U.S. Index moved in tandem with the MSCI ex-U.S. Index through June 2023 before a gap in performance began showing. Between the beginning of 2023 and end of February 2024, U.S. stocks outperformed ex-U.S. stocks by almost 15%. It should come as no surprise that tech is a large reason for this outperformance. The S&P 500 Tech Index produced a total return of 74.43% since the beginning of 2023, while the S&P 500 Ex-Tech Index returned just 17.55%. Drilling down even further, tech’s outperformance has been driven largely by the Magnificent Seven. Facebook/Meta, Apple, Amazon, Google/Alphabet, Microsoft, Nvidia, and Tesla have risen almost 312% since the beginning of 2019. The remaining 493 stocks in the S&P 500 produced a return of just 78%.
China is the Topic du Jour: Tactical offsides sentiment aside, one of the best/favorite market statistics: over the last 30 years is that the MSCI China index has posted a total return of 0%. That’s been accompanied by 22 intra-year corrections of -20% (vs. 6 for the S&P 500) and an average annual correction of -30% (2x the S&P 500). China ETFs are also one of the few categories where there have been more inflows than current AUM, as it continues to tempt investors to play a trading game. Simply put, being long in China can have its short-term rewards, but the toll is an immense amount of volatility.
Markets to begin 2024: A word of caution in Q1 is that the equity market seems as convinced about a soft landing today as it was convinced of a recession in 2022. In both cases, the short-term lesson is not to stand in the way of a market that wants to express an opinion, while the longer-term lesson is that the economy is a tortoise, and no matter the conviction level the equity market wants to have, the economy will take longer than most think to reveal its ultimate answer.
The Need for Monetary Policy Equilibrium: Monetary policy equilibrium can be generally defined as 1) the Fed behaving the way the market expects, and 2) the market behaving the way the Fed expects. A better monetary policy equilibrium will occur when the Fed’s “dot” forecasts and market expectations converge. This equilibrium may only be cemented after the first Fed rate cut in 2024 since there are two major monetary policy questions now: 1) when does the return to a more neutral rate start; and 2) how low is the Fed funds rate going to go (where is neutral?). During the month, the market finally reached equilibrium.
Earnings Season Recap: As far as 2024 goes, the 2024 estimates still sit between $243-$244 with growth maintaining its roughly 10% rate for next year. Overall earnings growth for Q4 ’23 looks like it will come in at about 10%, just 1% below the October 1st estimate. Growth-oriented sectors still lead the index with Communications, Discretionary & Technology seeing the strongest growth. Furthermore, Staples is now the fifth sector to exceed its Oct. 1st estimate which shows broad-based improvement in fundamentals. Revenue growth is running at 3.4% and once again growth sectors are leading the way. Comparing the next 12-month earnings contribution to market cap weights by sector continues to show that the Financial and Energy sectors are expected to earn more than their current weights in the index. Technology on the other hand shows it trades at a premium compared to its sector weight and the MAG 7 specifically is an even larger weight.
The Presidential Election Year: Since ‘52, the S&P 500 has not declined in a year in which an incumbent president was running for re-election (avg. return of 10%). Stocks have declined in presidential election years, but in each of those cases, it was a year in which there was an open election with no incumbent running (‘60, ‘00, and ‘08). Presidents want to be re-elected and will use whatever policy levers are needed to boost the US economy. In fact, every president who avoided a recession two years before their re-election went on to win the election. And every president who had a recession in the two years before their re-election went on to lose.
Earnings: ‘24 S&P 500 EPS = $243 (+10.5%). 2023 = $220 (+0.5%). 2022 = $219 (+7.4%). 2021 = $204. 2020 = $136. 2019 = $161. *
Valuations: S&P 500 Fwd. P/E (NTM): 20.8x, EAFE: 14.5x, EM: 11.9x, R1V: 16.0x, and R1G: 27.5x.*
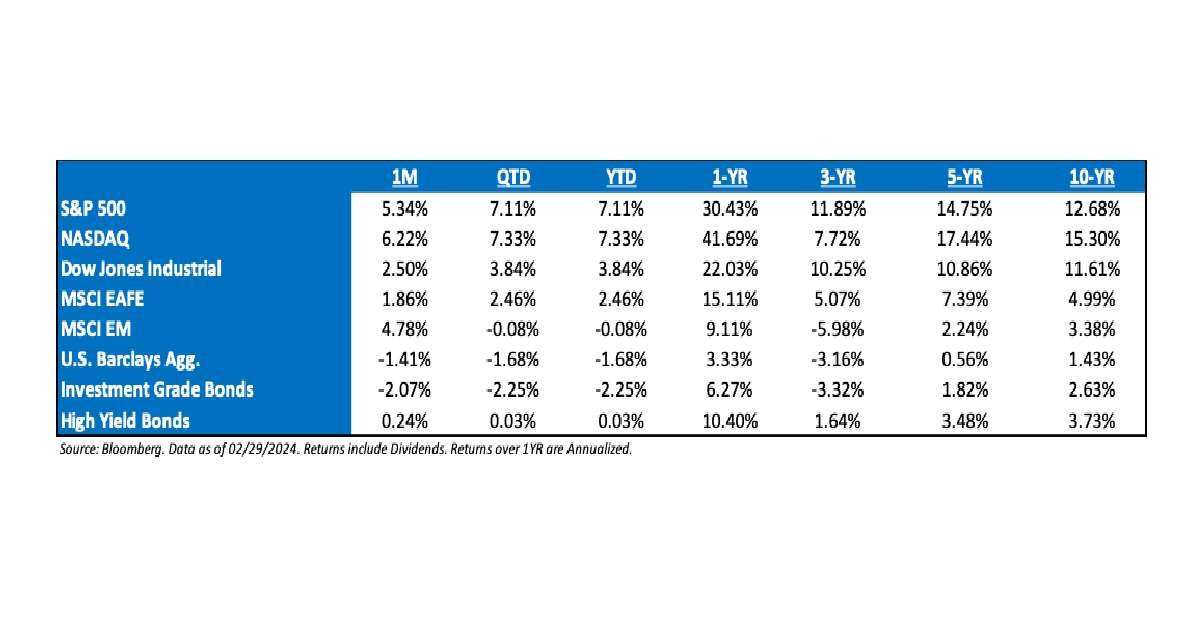
*Source: Bloomberg and FactSet, Data as of 02/29/24
Disclosures
Aptus Capital Advisors, LLC is a Registered Investment Advisor (RIA) registered with the Securities and Exchange Commission and is headquartered in Fairhope, Alabama. Registration does not imply a certain level of skill or training. For more information about our firm, or to receive a copy of our disclosure Form ADV and Privacy Policy call (251) 517-7198 or contact us here. Information presented on this site is for educational purposes only and does not intend to make an offer or solicitation for the sale or purchase of any securities.
This commentary offers generalized research, not personalized investment advice. It is for informational purposes only and does not constitute a complete description of our investment services or performance. Nothing in this commentary should be interpreted to state or imply that past results are an indication of future investment returns. All investments involve risk and unless otherwise stated, are not guaranteed. Be sure to consult with an investment & tax professional before implementing any investment strategy.
Past performance is not indicative of future results. This material is not financial advice or an offer to sell any product. The information contained herein should not be considered a recommendation to purchase or sell any particular security. Forward looking statements cannot be guaranteed.
The S&P 500® is widely regarded as the best single gauge of large-cap U.S. equities. There is over USD 11.2 trillion indexed or benchmarked to the index, with indexed assets comprising approximately USD 4.6 trillion of this total. The index includes 500 leading companies and covers approximately 80% of available market capitalization.
The Nasdaq Composite Index measures all Nasdaq domestic and international based common type stocks listed on The Nasdaq Stock Market. To be eligible for inclusion in the Index, the security’s U.S. listing must be exclusively on The Nasdaq Stock Market (unless the security was dually listed on another U.S. market prior to January 1, 2004 and has continuously maintained such listing). The security types eligible for the Index include common stocks, ordinary shares, ADRs, shares of beneficial interest or limited partnership interests and tracking stocks. Security types not included in the Index are closed-end funds, convertible debentures, exchange traded funds, preferred stocks, rights, warrants, units and other derivative securities.
The Dow Jones Industrial Average® (The Dow®), is a price-weighted measure of 30 U.S. blue-chip companies. The index covers all industries except transportation and utilities.
The MSCI EAFE Index is an equity index which captures large and mid-cap representation across 21 Developed Markets countries*around the world, excluding the US and Canada. With 902 constituents, the index covers approximately 85% of the free float-adjusted market capitalization in each country.
The MSCI Emerging Markets Index captures large and mid-cap representation across 26 Emerging Markets (EM) countries*. With 1,387 constituents, the index covers approximately 85% of the free float-adjusted market capitalization in each country.
Investment-grade Bond (or High-grade Bond) are believed to have a lower risk of default and receive higher ratings by the credit rating agencies. These bonds tend to be issued at lower yields than less creditworthy bonds.
Non-investment-grade debt securities (high-yield/junk bonds) may be subject to greater market fluctuations, risk of default or loss of income and principal than higher-rated securities.
The Bloomberg Barclays U.S. Aggregate Bond Index is a broad-based benchmark that measures the investment grade, U.S. dollar-denominated, fixed-rate taxable bond market. This includes Treasuries, government-related and corporate securities, mortgage-backed securities, asset-backed securities, and collateralized mortgage-backed securities. ACA-2403-4.
