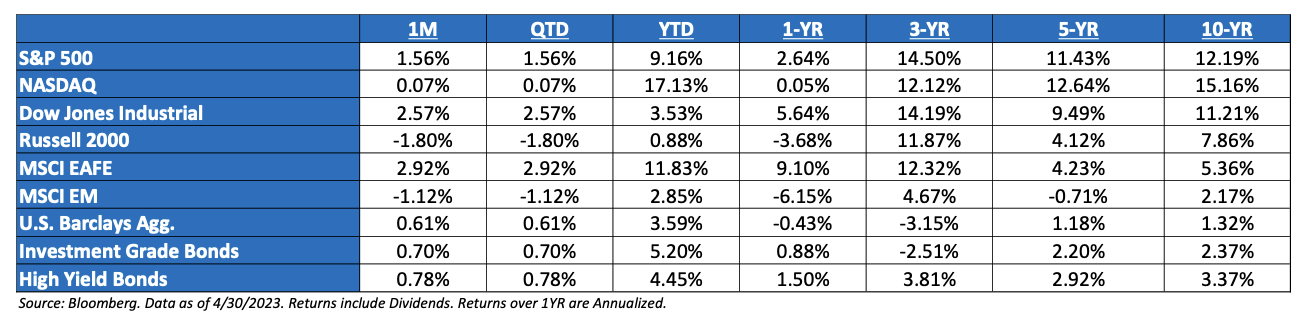
April ‘23 Market Recap: Despite elevated macro and micro uncertainty, the S&P 500 rallied 1.5% in April. Keeping with positive correlation, fixed income continues to trade in the same direction as equities. The recent sharp decline in equity market breadth also points to elevated risk of a drawdown. Market breadth shows that the outperformance has been very top heavy via the Mega-Caps, while the average stock continues to perform poorly year-to-date. As of month end, the top 10 largest stocks have driven almost 90% of the markets ’23 returns. Historically, sharp declines in market breadth can be a useful signal for short-term equity market returns. Following the last nine (9) sharp declines of a similar magnitude since 1980, the S&P 500 has posted below-average subsequent returns and larger peak-to-trough drawdowns.
Market Anomalies: Equities will also soon enter a weak seasonal stretch of the year, which many investors know by the adage “sell in May and go away.” The S&P 500 has averaged an annualized return of just 5% from May through October, as compared with 13% from January through April and 17% from November through December. Although investors know that past performance does not guarantee future results, popular narratives can often become self-fulfilling prophecies.
Hard or Soft Landing: Cutting through the noise, we started 2023 with this major question: Hard landing or soft landing? Since the start of the year, the Fed has hiked rates 50 basis points, and the markets are betting for another hike in the beginning of May. A regional banking crisis or a pivot does not make a soft landing more likely, as underlying market issues remain apparent. That said, the resilient nature of the market must be respected, and clearly there have been real positives over the past three months as earnings have been better than feared, as has economic growth.
The Debt Ceiling: As the intensity of the banking problems has receded, the US debt limit is slowly gaining attention. The latest tax filings showed the U.S. Treasury that the deadline is likely to fall in early June and while we expect a resolution ahead of the deadline, the risks of failure are higher than at least since 2011 and the timing may well go down to the wire. Concern about a failure to resolve the debt ceiling in a timely fashion is one of the key risks in the near-term market forecasts, but the process in which it is resolved is just as important as getting it resolved.
Earnings Season: Over half of the S&P 500 companies have reported – 80% beating the median earnings estimate on Wall Street. This is above the 72% average beat rate since the end of the Great Recession. Basically, stating that Q1 earnings proved to be more resilient than feared. Though earnings are not strong, they are much stronger than consensus expectations. The driving force behind the resiliency in earnings revisions breadth is the expectation that an upward inflection in 2H ’23 and ’24 EPS growth will come to fruition. It’s also rooted in the view that companies broadly have already right-sized expenses and that margin expansion can now take hold. We remain skeptics, as operating leverage cuts both ways in a rising and declining inflationary environment.
The Fed Update: The Fed raised their Federal Funds rate by 500 bps in one year. The surprise up until the last couple weeks has been the minimal impact the tightening cycle has had on both the real economy and financial markets. It does appear the banking sector has finally begun to feel the pain of the hikes and inverted yield curve. We believe that continued stickier inflation could pin the Fed between a proverbial “rock and a hard place”, as policy makers would face the decision of either continuing the fight against stickier-than-expected inflation with aggressive policy, or risk sending the global financial system into another crisis as collateral damage increases.
What Concerns Us the Most: In short: 1) Continued volatility and contagion in banking sector; 2) Inflation transitions to growth frustration; 3) The potential for a Fed policy error and continued collateral damage; 4) A general tendency to think about the economy and stock prices in V-shaped terms, i.e., a Fed Pivot saving the day.
S&P Valuation: The S&P 500 valuation increased over the month, as the market rallied off a better-than-anticipated earnings cycle. Forward earnings expectations ticked up slightly, even amidst a continuation of tightening credit standards.
Earnings: ‘22 S&P 500 op. earnings = $219 (+7.4%). 2023 = $222 (+1.8%). 2021 = $204. 2020 = $136. 2019 = $161. *
Valuations: S&P 500 Fwd. P/E: 18.9x, EAFE: 13.9x, EM: 12.2x, R1V: 16.6x, R1G: 27.0x, and R2K: 15.2x.*
*Source: Bloomberg and FactSet, Data as of 4/30/23
Disclosures
Aptus Capital Advisors, LLC is a Registered Investment Advisor (RIA) registered with the Securities and Exchange Commission and is headquartered in Fairhope, Alabama. Registration does not imply a certain level of skill or training. For more information about our firm, or to receive a copy of our disclosure Form ADV and Privacy Policy call (251) 517-7198 or contact us here. Information presented on this site is for educational purposes only and does not intend to make an offer or solicitation for the sale or purchase of any securities.
This commentary offers generalized research, not personalized investment advice. It is for informational purposes only and does not constitute a complete description of our investment services or performance. Nothing in this commentary should be interpreted to state or imply that past results are an indication of future investment returns. All investments involve risk and unless otherwise stated, are not guaranteed. Be sure to consult with an investment & tax professional before implementing any investment strategy.
Past performance is not indicative of future results. This material is not financial advice or an offer to sell any product. The information contained herein should not be considered a recommendation to purchase or sell any particular security. Forward looking statements cannot be guaranteed.
The S&P 500® is widely regarded as the best single gauge of large-cap U.S. equities. There is over USD 11.2 trillion indexed or benchmarked to the index, with indexed assets comprising approximately USD 4.6 trillion of this total. The index includes 500 leading companies and covers approximately 80% of available market capitalization.
The Nasdaq Composite Index measures all Nasdaq domestic and international based common type stocks listed on The Nasdaq Stock Market. To be eligible for inclusion in the Index, the security’s U.S. listing must be exclusively on The Nasdaq Stock Market (unless the security was dually listed on another U.S. market prior to January 1, 2004 and has continuously maintained such listing). The security types eligible for the Index include common stocks, ordinary shares, ADRs, shares of beneficial interest or limited partnership interests and tracking stocks. Security types not included in the Index are closed-end funds, convertible debentures, exchange traded funds, preferred stocks, rights, warrants, units and other derivative securities.
The Dow Jones Industrial Average® (The Dow®), is a price-weighted measure of 30 U.S. blue-chip companies. The index covers all industries except transportation and utilities.
The Russell 2000® Index measures the performance of the small-cap segment of the US equity universe. The Russell 2000® Index is a subset of the Russell 3000® Index representing approximately 10% of the total market capitalization of that index. It includes approximately 2,000 of the smallest securities based on a combination of their market cap and current index membership. The Russell 2000® is constructed to provide a comprehensive and unbiased small-cap barometer and is completely reconstituted annually to ensure larger stocks do not distort the performance and characteristics of the true small-cap opportunity set.
The MSCI EAFE Index is an equity index which captures large and mid-cap representation across 21 Developed Markets countries*around the world, excluding the US and Canada. With 902 constituents, the index covers approximately 85% of the free float-adjusted market capitalization in each country.
The MSCI Emerging Markets Index captures large and mid-cap representation across 26 Emerging Markets (EM) countries*. With 1,387 constituents, the index covers approximately 85% of the free float-adjusted market capitalization in each country.
Investment-grade Bond (or High-grade Bond) are believed to have a lower risk of default and receive higher ratings by the credit rating agencies. These bonds tend to be issued at lower yields than less creditworthy bonds.
Non-investment-grade debt securities (high-yield/junk bonds) may be subject to greater market fluctuations, risk of default or loss of income and principal than higher-rated securities.
Nasdaq-100® includes 100 of the largest domestic and international non-financial companies listed on the Nasdaq Stock Market based on market capitalization.
The Bloomberg Barclays U.S. Aggregate Bond Index is a broad-based benchmark that measures the investment grade, U.S. dollar-denominated, fixed-rate taxable bond market. This includes Treasuries, government-related and corporate securities, mortgage-backed securities, asset-backed securities, and collateralized mortgage-backed securities. ACA-2305-1.
