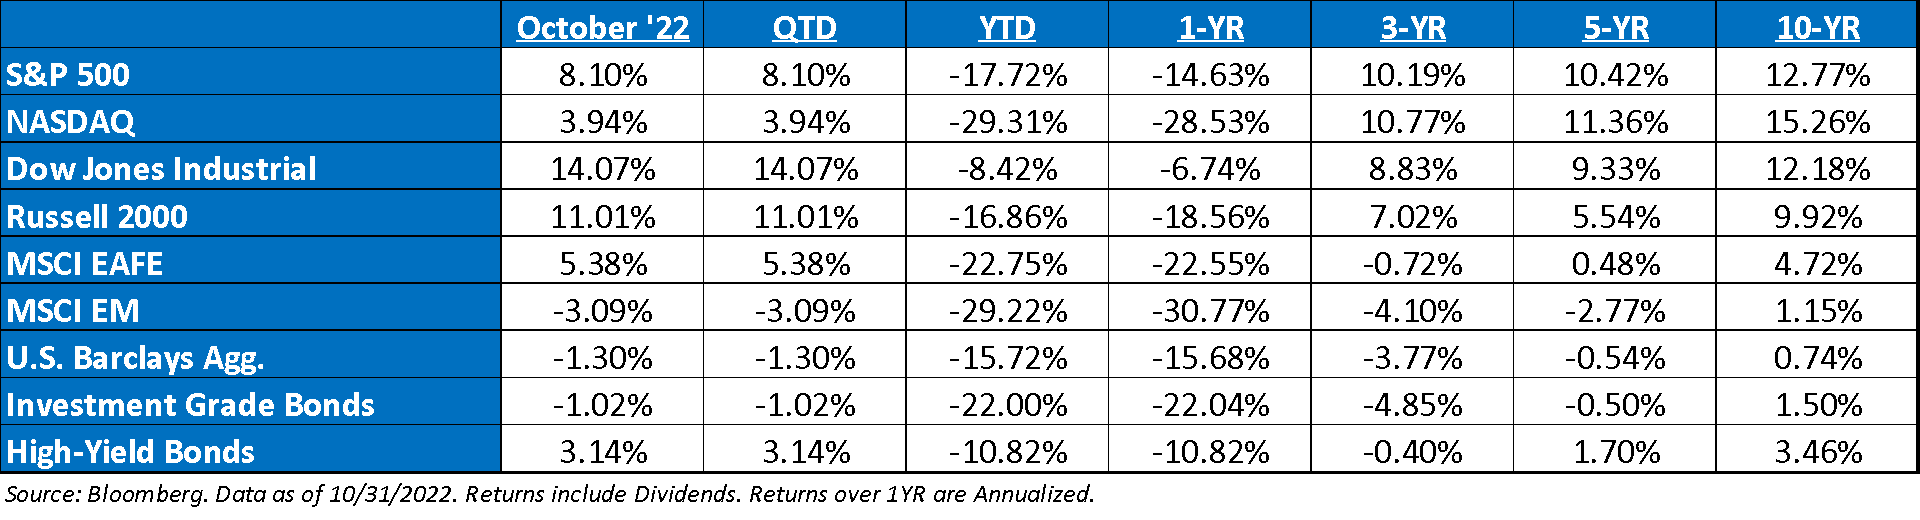
October 2022 Market Recap: The market ended the month +8.1% in October, as Q3 earnings season looks to be a complete redux of Q2 earnings season. There has been earnings weakness, but largely not as bad as feared in aggregate, while the market seems to be focused on the optimistic side of the coin (Fed rate hikes are likely coming to an end in early 2023) and betting the Fed may set a more dovish tone in their November meeting as Canada/Australia have done in the last month. It seems volatility is the safe bet, as it’s unclear the tone the Fed may take, though the market is clearly betting on something at least modestly more dovish than the prior few meetings.
FOMC Preview: Even those who have argued in favor of a slowdown in monetary policy admit that bringing inflation down is the top priority at this point. A slowdown surely would have the benefit of reducing the odds of doing too much damage to the economy or to produce serious financial strains. But it would also increase the odds of more tightening later if inflation proves again to be persistent. Remember also, regardless of whether or not the Fed slows down in December, it will still hike substantially more (at least a percentage point more) after the November meeting.
Recent GDP Readings: After two consecutive quarters of decline, US GDP rebounded sharply at an annualized 2.6% in the third quarter, but the snapback resulted from a dramatic swing in trade, inventories, and government spending. Indeed, trade boosted GDP growth by 2.8%, reflecting strong exports – which was a weakness in the previous reports. GDP excluding inventories, trade, and government spending has steadily lost steam since the start of this year, coming in at just 0.08% in Q3.
No Help from Bond Markets: The pain in the bond market largely continued in October, with the U.S. Aggregate Index now down almost 16% year-to-date. Since the late 1970s, no other year has come close to experiencing similar pain in the bond market. U.S. bonds are now 17.3% off their peak in July ‘20. Except for the drawdown that ended in February 1980 (when the index was only calculated monthly), this is almost twice as large as the next biggest drawdown on record.
Where is The Fed Put? We continue to believe that the Fed Put is much lower right now, as FOMC Chairman Jerome Powell, has stated that the Fed is going to keep raising until we have a recession unless inflation meaningfully improves. The cause of the decline is equally important. The Fed has a long history of easing policy in response to earnings drops, but there isn’t much evidence that it responds to multiple compression. The fact that inflation is higher than at any time since the genesis of the Fed Put and that stocks have appreciated a lot over the past two years suggest the strike is well below current prices. Similarly, the recent decline in stock prices owes exclusively to lower multiples; it would take another leg down induced by a drop in earnings to impress the Fed.
“Phantom Earnings” Moving Forward: Earnings likely to play an increasingly bigger role from a directional standpoint given the debate about the extent to which consensus estimates still need to come down to reflect a softening macro backdrop and inflation/margin pressures. We remain skeptics that the current 2023 earnings expectations for the S&P 500 remain too high. On average, earnings, as a whole, tend to fall between 15% – 20%, of which, earnings are only 7% off their highs.
Earnings Season: Much like last earnings season, price dispersion is picking up for the S&P 500, which should present opportunity for stock pickers. Interestingly, the rise in dispersion is particularly stark for the 5% of the index with the greatest market cap, although recent negative post-reporting price reactions from several tech giants have done little to detract from the S&P 500’s rally over the past couple of weeks. One reason the index is holding up, in their view, is that guidance in aggregate just isn’t bearish enough yet. While the tone is weaker overall, 2023 EPS estimates have been sticky. EPS growth is expected to be 4.2% and sales growth is running at 10.3%. Excluding the energy sector, earnings growth would be negative.
S&P Valuation: The S&P 500 valuation increased over the month, as the market had a strong month, coupled with earnings expectations fell 3%. The market trades at 17.2x (14.7x last month).
Earnings – 2022 S&P 500 operating earnings = $219 (+10.3%). 2023 = $235 (+7.3%). 2021 = $204. 2020 = $136. 2019 = $161. *
Valuations: S&P 500 Fwd. P/E: 17.2x, EAFE: 11.4x, EM: 9.7x, R1V: 13.6x, R1G: 22.6x, and R2K: 12.1x. *
*Source: Bloomberg and FactSet, Data as of 10/31/22
Disclosures
Aptus Capital Advisors, LLC is a Registered Investment Advisor (RIA) registered with the Securities and Exchange Commission and is headquartered in Fairhope, Alabama. Registration does not imply a certain level of skill or training. For more information about our firm, or to receive a copy of our disclosure Form ADV and Privacy Policy call (251) 517-7198 or contact us here. Information presented on this site is for educational purposes only and does not intend to make an offer or solicitation for the sale or purchase of any securities.
This commentary offers generalized research, not personalized investment advice. It is for informational purposes only and does not constitute a complete description of our investment services or performance. Nothing in this commentary should be interpreted to state or imply that past results are an indication of future investment returns. All investments involve risk and unless otherwise stated, are not guaranteed. Be sure to consult with an investment & tax professional before implementing any investment strategy.
Past performance is not indicative of future results. This material is not financial advice or an offer to sell any product. The information contained herein should not be considered a recommendation to purchase or sell any particular security. Forward looking statements cannot be guaranteed.
The S&P 500® is widely regarded as the best single gauge of large-cap U.S. equities. There is over USD 11.2 trillion indexed or benchmarked to the index, with indexed assets comprising approximately USD 4.6 trillion of this total. The index includes 500 leading companies and covers approximately 80% of available market capitalization.
The Nasdaq Composite Index measures all Nasdaq domestic and international based common type stocks listed on The Nasdaq Stock Market. To be eligible for inclusion in the Index, the security’s U.S. listing must be exclusively on The Nasdaq Stock Market (unless the security was dually listed on another U.S. market prior to January 1, 2004 and has continuously maintained such listing). The security types eligible for the Index include common stocks, ordinary shares, ADRs, shares of beneficial interest or limited partnership interests and tracking stocks. Security types not included in the Index are closed-end funds, convertible debentures, exchange traded funds, preferred stocks, rights, warrants, units and other derivative securities.
The Dow Jones Industrial Average® (The Dow®), is a price-weighted measure of 30 U.S. blue-chip companies. The index covers all industries except transportation and utilities.
The Russell 2000® Index measures the performance of the small-cap segment of the US equity universe. The Russell 2000® Index is a subset of the Russell 3000® Index representing approximately 10% of the total market capitalization of that index. It includes approximately 2,000 of the smallest securities based on a combination of their market cap and current index membership. The Russell 2000® is constructed to provide a comprehensive and unbiased small-cap barometer and is completely reconstituted annually to ensure larger stocks do not distort the performance and characteristics of the true small-cap opportunity set.
The MSCI EAFE Index is an equity index which captures large and mid-cap representation across 21 Developed Markets countries*around the world, excluding the US and Canada. With 902 constituents, the index covers approximately 85% of the free float-adjusted market capitalization in each country.
The MSCI Emerging Markets Index captures large and mid-cap representation across 26 Emerging Markets (EM) countries*. With 1,387 constituents, the index covers approximately 85% of the free float-adjusted market capitalization in each country.
Investment-grade Bond (or High-grade Bond) are believed to have a lower risk of default and receive higher ratings by the credit rating agencies. These bonds tend to be issued at lower yields than less creditworthy bonds.
Non-investment-grade debt securities (high-yield/junk bonds) may be subject to greater market fluctuations, risk of default or loss of income and principal than higher-rated securities.
Nasdaq-100® includes 100 of the largest domestic and international non-financial companies listed on the Nasdaq Stock Market based on market capitalization.
The Bloomberg Barclays U.S. Aggregate Bond Index is a broad-based benchmark that measures the investment grade, U.S. dollar-denominated, fixed-rate taxable bond market. This includes Treasuries, government-related and corporate securities, mortgage-backed securities, asset-backed securities, and collateralized mortgage-backed securities. ACA-2211-1.
