October ’23 Market Recap: In a part of the year, in which the market tends to witness some seasonal weakness, the S&P notched its first negative three-month performance since 2020. The S&P 500 was down -2.10%. This has been a stressful few months for investors, as the S&P 500 has given up nearly half of its gain from the recent market peak. There were few places to hide amidst the market pullback that weighed on all size and style boxes and most sectors. For equity investors, it felt like they were tourists in a bond market world, as interest rates continue to rule everything around us. Lastly, this month continued to witness positive correlation between equities and fixed income – a common theme over the last 22 months.
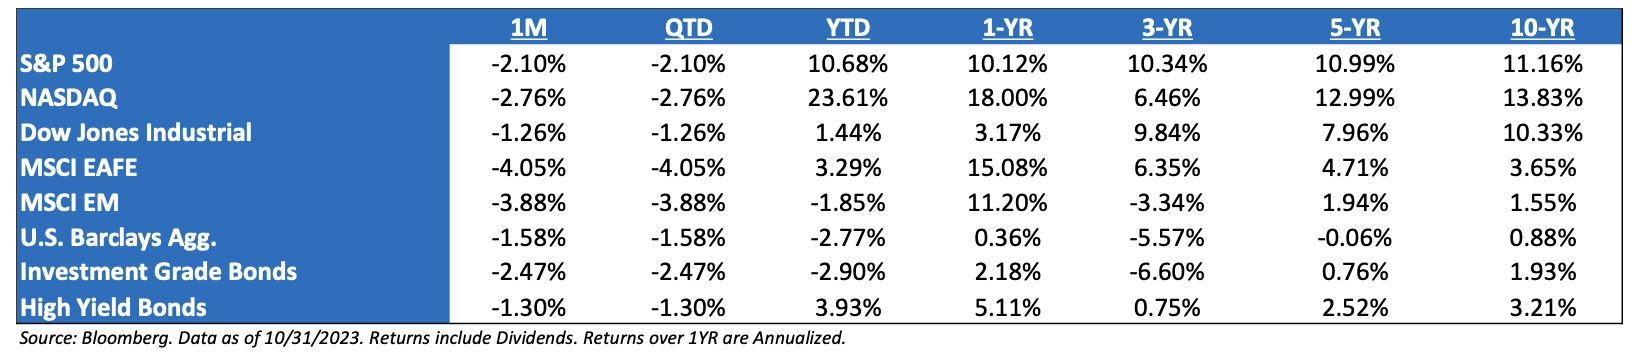
Fixed Income Woes Continue: Rather than reverting to the mean as many investors expected, bond returns are in the midst of an encore performance of last year’s terrible returns. Year-to-date, the U.S. Barclays AGG is down -2.77% on a total return basis. With data going back to 1976, this ranks as the third worst YTD return for bonds through October 31. Only last year and 1994 saw worse returns at similar points in the year. In fact, the U.S. Agg Index has only posted negative yearly returns five times in almost 50 years of history – 1994, 1999, 2013, 2021, and 2022. Bonds are at risk of marking a sixth year of negative returns – its third straight.
The Fixed Income Drawdown: Examining the bond market’s losses over a longer timeframe shows this remains one of the worst drawdowns on record. The U.S. Aggregate Index is still 17% from its previous peak. At its lowest point during this bear market, bonds were over 18% off their peak. No other drawdown on record could match such sustained losses (with the caveat that data only goes back to the late 1970s and was monthly at that point).
Must Keep Taking about “The Mag Seven” (AGAIN): Though the end of the month, the 10 largest S&P 500 constituent weights have contributed over 134% of YTD gains. It’s a historically aggressive reading and one exemplified by the continued weakness from non-mega-cap Growth areas of the ETF spectrum.
Third Quarter Earnings Season: With over half of the S&P 500 constituents already reporting, the expected growth rate for earnings jumped to 4.3%, which is up from the Oct. 1st estimate of 1.6% and even above the April 1st estimate of 2.8%. From a revenue standpoint, growth expectations of 1.4% are slightly above beginning of the quarter expectations of 0.8%. Looking out to 2024 so far, net income for next year has moved lower by just -0.4% thus far. The third quarter reporting season usually provides a wave of guidance for the following year but we are seeing less of that this year. In all likelihood, the uncertainty around the macro environment, consumer spending, future path of interest rates, etc. is causing managements to punt on their view. This is likely to cause investors to remain cautious as it does not instill confidence amongst the analyst community.
Small-Cap Performance: It has been a very rough last 3 months with Small Caps off 16.7% vs. -8.6% for the S&P 500 and 8.4% for the QQQ. Small Caps are back to June ’22 lows and off 32% since it peaked in November ’21. Small is in jeopardy of posting losses for two straight years, which has only happened one other time using the small-cap universe. That was ’07-’08 and small rebounded 27% in ’09.
November Fed Meeting: The revised “dot plot” from the September meeting was hawkish, but the November meeting felt a bit more dovish, after the recent rise in nominal yields. With no surprise to the market, the Fed left their target fed funds rate between 5.25% and 5.50%. Unlike the September edition, the accompanying statement at least implicitly offered a justification for skipping this time, with the expanded reference to “tighter *financial* and credit conditions” that “likely” weigh on the economy, albeit still to an “uncertain” extent. This language seems rather anodyne, notably sandwiched in a second paragraph that’s seemed long-in-the-tooth and due a refresh. The hiking cycle has now meandered from its previous every-other-meeting groove, arguably largely if not exclusively on this account. Still, as the Chair conveyed at the presser, tighter conditions need to persist to alter meaningfully the path of monetary policy.
Thoughts on GDP: In the middle of August, the consensus estimate for US GDP in Q3 was 0.5%, as we learned at the end of the month, US GDP in Q3 was not 0.5%, it was 10x higher than that. The reading came in at 4.9%. Remember that GDP is recorded in real terms, not nominal Thus, much like the recent retail sales figures, spending continues. The upshot of Q3 GDP is that the economy landed in the Fed’s sweet spot — strong real growth and decelerating inflation. Nonetheless, the strength in GDP has been somewhat negated by Visa’s and Mastercard’s recent earnings reports which flagged slowing volumes in October.
What Concerns Us the Most: In short: 1) Continued volatility; 2) Inflation transitions to growth frustration; 3) The potential for a Fed policy error and continued collateral damage; 4) A general tendency to think about the economy and stock prices in V-shaped terms, i.e., a Fed Pivot saving the day.
Earnings: ‘23 S&P 500 op. earnings = $222 (+1.4%). 2022 = $219 (+7.4%). 2021 = $204. 2020 = $136. 2019 = $161. *
Valuations: S&P 500 Fwd. P/E (NTM): 17.6 x, EAFE: 12.4x, EM: 11.1x, R1V: 13.6x, and R1G: 23.5x.*
*Source: Bloomberg and FactSet, Data as of 10/31/23
Disclosures
Aptus Capital Advisors, LLC is a Registered Investment Advisor (RIA) registered with the Securities and Exchange Commission and is headquartered in Fairhope, Alabama. Registration does not imply a certain level of skill or training. For more information about our firm, or to receive a copy of our disclosure Form ADV and Privacy Policy call (251) 517-7198 or contact us here. Information presented on this site is for educational purposes only and does not intend to make an offer or solicitation for the sale or purchase of any securities.
This commentary offers generalized research, not personalized investment advice. It is for informational purposes only and does not constitute a complete description of our investment services or performance. Nothing in this commentary should be interpreted to state or imply that past results are an indication of future investment returns. All investments involve risk and unless otherwise stated, are not guaranteed. Be sure to consult with an investment & tax professional before implementing any investment strategy.
Past performance is not indicative of future results. This material is not financial advice or an offer to sell any product. The information contained herein should not be considered a recommendation to purchase or sell any particular security. Forward looking statements cannot be guaranteed.
The S&P 500® is widely regarded as the best single gauge of large-cap U.S. equities. There is over USD 11.2 trillion indexed or benchmarked to the index, with indexed assets comprising approximately USD 4.6 trillion of this total. The index includes 500 leading companies and covers approximately 80% of available market capitalization.
The Nasdaq Composite Index measures all Nasdaq domestic and international based common type stocks listed on The Nasdaq Stock Market. To be eligible for inclusion in the Index, the security’s U.S. listing must be exclusively on The Nasdaq Stock Market (unless the security was dually listed on another U.S. market prior to January 1, 2004 and has continuously maintained such listing). The security types eligible for the Index include common stocks, ordinary shares, ADRs, shares of beneficial interest or limited partnership interests and tracking stocks. Security types not included in the Index are closed-end funds, convertible debentures, exchange traded funds, preferred stocks, rights, warrants, units and other derivative securities.
The Dow Jones Industrial Average® (The Dow®), is a price-weighted measure of 30 U.S. blue-chip companies. The index covers all industries except transportation and utilities.
The MSCI EAFE Index is an equity index which captures large and mid-cap representation across 21 Developed Markets countries*around the world, excluding the US and Canada. With 902 constituents, the index covers approximately 85% of the free float-adjusted market capitalization in each country.
The MSCI Emerging Markets Index captures large and mid-cap representation across 26 Emerging Markets (EM) countries*. With 1,387 constituents, the index covers approximately 85% of the free float-adjusted market capitalization in each country.
Investment-grade Bond (or High-grade Bond) are believed to have a lower risk of default and receive higher ratings by the credit rating agencies. These bonds tend to be issued at lower yields than less creditworthy bonds.
Non-investment-grade debt securities (high-yield/junk bonds) may be subject to greater market fluctuations, risk of default or loss of income and principal than higher-rated securities.
Nasdaq-100® includes 100 of the largest domestic and international non-financial companies listed on the Nasdaq Stock Market based on market capitalization.
The Bloomberg Barclays U.S. Aggregate Bond Index is a broad-based benchmark that measures the investment grade, U.S. dollar-denominated, fixed-rate taxable bond market. This includes Treasuries, government-related and corporate securities, mortgage-backed securities, asset-backed securities, and collateralized mortgage-backed securities. ACA-2311-4.
