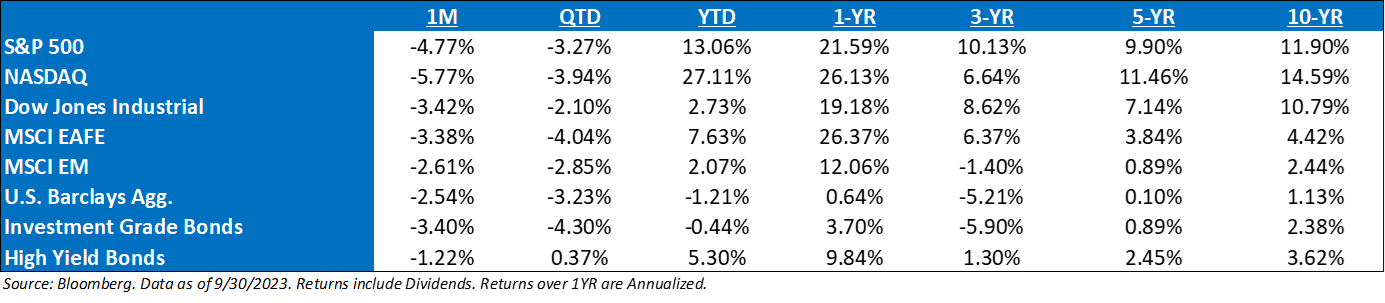
September ’23 Market Recap: As the weakest seasonal period for equities historically, September is doing what September does. The S&P 500 was down -4.8%. This was a stressful quarter for investors with few places to hide amidst the market pullback that weighed on all size and style boxes and most sectors. Noteworthy developments in the quarter include the sharp rise in interest rates to new multi-decade highs and a nearly 30% increase in oil prices. This combination reignited concerns about the health of the US consumer and the possibility of an upcoming recession. Quality themes continued to outperform amidst economic uncertainty.
Must Keep Talking about “The Mag Seven”: The sharp recent increase in Treasury yields has weighed on the valuations of the largest seven mega-cap tech stocks (AAPL, MSFT, AMZN, GOOGL, NVDA, TSLA, META) that collectively account for 27% of the S&P 500 index. While consensus sales and earnings expectations for the largest tech stocks have been upgraded since the start of August, the group has underperformed the other 493 S&P 500 companies by 4% over that time (-7% vs. -3%).
Macro Talking Points:
- US macro resilience has surprised economists in 2023, forcing many to embrace a supposedly “impossible” soft landing (or postpone their recession forecasts until 2024…).
- Not only were there powerful forces supporting activity, but the majority of economists had an overly deterministic view about the state of the economic cycle. As we have been pointing out for over two years, this is no ordinary business cycle,
- While the path to a soft landing remains uncomfortably narrow and the risk of a recession has not gone away, the US economy has – so far – managed to stay on course.
- Outside the US, the macro environment is looking decidedly shakier. With much larger exposures to global trade and manufacturing bullwhips, the economies of Europe and Asia are sliding towards a more recessionary dynamic – not helped, by China’s structural slump.
- But the most encouraging story in 2023 has been on the inflation front. Underlying inflation dynamics have improved substantially. The US is leading but others should follow.
- The recent spike in oil prices is (hopefully) not the start of a dreaded “second wave”. But it is a timely reminder that inflation will be far more volatile in the 2020s.
September Fed Meeting: The revised “dot plot” from the September meeting was hawkish. The Fed is projecting one more hike in 2023, for a terminal rate of 5.5-5.75%. We have argued that it makes sense to leave the last hike in the dot plot for the sake of optionality, even if the Fed does not ultimately deliver that hike. The median dot for 2024 moved up by 50bp to 5.125%, indicating just two cuts next year. We had flagged this as a risk scenario, but we were expecting just a 25bp increase in the 2024 median. The 2025 and 2026 medians were at 3.875% and 2.875%, respectively, in line with our expectations. Contrary to our expectations, the longer-run dot did not increase. It remained at 2.5%
Thoughts on GDP: It appears that GDP may hit a pothole into the end of the year. Reasons include 1) the end of the student loan moratorium, 2) the autoworker strike, 3) the increase in oil prices, 4) the tightening in financial conditions on the back of a “higher for longer” Fed outlook, and 5) the apparent slowdown in consumer spending after a very strong summer. All told, many analysts estimate that real GDP growth will slow from 3.5% in Q3 to 0.7% in Q4.
Jackson Hole Recap: Fed Chair Powell delivered what we thought was a balanced assessment of the economic and monetary policy outlook at Jackson Hole last month. As expected, he gave little forward guidance on policy, instead emphasizing data dependence… There were a few hawkish elements in Powell’s speech. He mentioned that the Fed is vigilant to the risk that the economy is not slowing as expected, particularly given the recent robust data – further tightening could be warranted. Second, Powell reiterated the Fed’s view that a period of below-trend growth and a softer labor market would be needed to get inflation back to 2%. In other words, the Fed does not believe in immaculate disinflation.
What Concerns Us the Most: In short: 1) Continued volatility; 2) Inflation transitions to growth frustration; 3) The potential for a Fed policy error and continued collateral damage; 4) A general tendency to think about the economy and stock prices in V-shaped terms, i.e., a Fed Pivot saving the day.
Thoughts Around Inflation: The inflation trend continues to look great, especially if one excludes shelter, even before any meaningful labor market softening has occurred. Inflation is simple now – +0.2% M/M gains until year end would get us below 3% headline and 2% Core by end of year. An average monthly report of 0.3% or higher keeps us above 3% on both. So, 0.2% and the disinflation camp wins, 0.3% and the sticky inflation camp wins. Right now, the disinflation camp looks like it’s winning, but changes in medical inflation calculations (10% of core CPI) will serve as a headwind starting this month, while commodities are the risk to this.
Earnings: ‘23 S&P 500 op. earnings = $222 (+1.4%). 2022 = $219 (+7.4%). 2021 = $204. 2020 = $136. 2019 = $161. *
Valuations: S&P 500 Fwd. P/E (NTM): 21.0 x, EAFE: 13.4x, EM: 13.0x, R1V: 15.9x, R1G: 29.0 x, and R2K: 15.4x.*
*Source: Bloomberg and FactSet, Data as of 9/30/23
Disclosures
Aptus Capital Advisors, LLC is a Registered Investment Advisor (RIA) registered with the Securities and Exchange Commission and is headquartered in Fairhope, Alabama. Registration does not imply a certain level of skill or training. For more information about our firm, or to receive a copy of our disclosure Form ADV and Privacy Policy call (251) 517-7198 or contact us here. Information presented on this site is for educational purposes only and does not intend to make an offer or solicitation for the sale or purchase of any securities.
This commentary offers generalized research, not personalized investment advice. It is for informational purposes only and does not constitute a complete description of our investment services or performance. Nothing in this commentary should be interpreted to state or imply that past results are an indication of future investment returns. All investments involve risk and unless otherwise stated, are not guaranteed. Be sure to consult with an investment & tax professional before implementing any investment strategy.
Past performance is not indicative of future results. This material is not financial advice or an offer to sell any product. The information contained herein should not be considered a recommendation to purchase or sell any particular security. Forward looking statements cannot be guaranteed.
The S&P 500® is widely regarded as the best single gauge of large-cap U.S. equities. There is over USD 11.2 trillion indexed or benchmarked to the index, with indexed assets comprising approximately USD 4.6 trillion of this total. The index includes 500 leading companies and covers approximately 80% of available market capitalization.
The Nasdaq Composite Index measures all Nasdaq domestic and international based common type stocks listed on The Nasdaq Stock Market. To be eligible for inclusion in the Index, the security’s U.S. listing must be exclusively on The Nasdaq Stock Market (unless the security was dually listed on another U.S. market prior to January 1, 2004 and has continuously maintained such listing). The security types eligible for the Index include common stocks, ordinary shares, ADRs, shares of beneficial interest or limited partnership interests and tracking stocks. Security types not included in the Index are closed-end funds, convertible debentures, exchange traded funds, preferred stocks, rights, warrants, units and other derivative securities.
The Dow Jones Industrial Average® (The Dow®), is a price-weighted measure of 30 U.S. blue-chip companies. The index covers all industries except transportation and utilities.
The MSCI EAFE Index is an equity index which captures large and mid-cap representation across 21 Developed Markets countries*around the world, excluding the US and Canada. With 902 constituents, the index covers approximately 85% of the free float-adjusted market capitalization in each country.
The MSCI Emerging Markets Index captures large and mid-cap representation across 26 Emerging Markets (EM) countries*. With 1,387 constituents, the index covers approximately 85% of the free float-adjusted market capitalization in each country.
Investment-grade Bond (or High-grade Bond) are believed to have a lower risk of default and receive higher ratings by the credit rating agencies. These bonds tend to be issued at lower yields than less creditworthy bonds.
Non-investment-grade debt securities (high-yield/junk bonds) may be subject to greater market fluctuations, risk of default or loss of income and principal than higher-rated securities.
Nasdaq-100® includes 100 of the largest domestic and international non-financial companies listed on the Nasdaq Stock Market based on market capitalization.
The Bloomberg Barclays U.S. Aggregate Bond Index is a broad-based benchmark that measures the investment grade, U.S. dollar-denominated, fixed-rate taxable bond market. This includes Treasuries, government-related and corporate securities, mortgage-backed securities, asset-backed securities, and collateralized mortgage-backed securities. ACA-2310-2.
