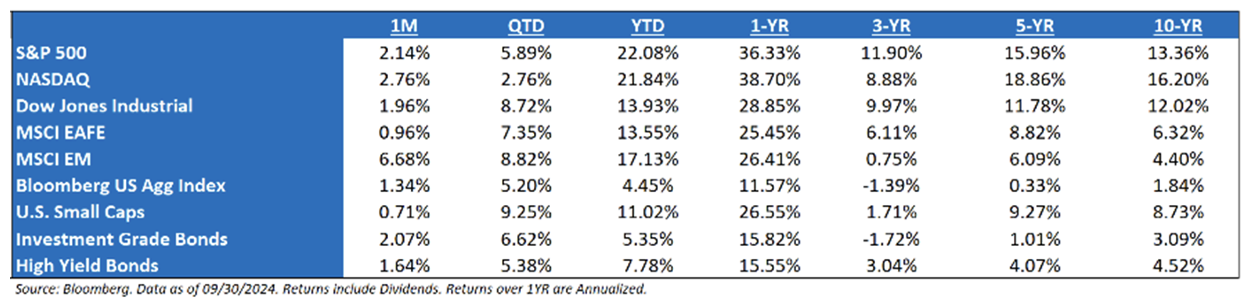
The Market Hit New Highs, From Different “Whys”: The character of the market changed in Q3, but the direction remained the same with strong breadth. Many have asked if this is a less powerful rally, but the data suggests otherwise: this is still a bull market and it has broadened. The equal-weight S&P (+9.48%) has outperformed its cap-weighted counterpart by 3.59%. The rate-cutting cycle has officially begun, as the market witnessed above trend growth and the absence of market trauma. The S&P 500 rose +5.89% during Q3 2024 to all-time highs as the economy expanded, and the Fed implemented a 50bps cut. The soft-landing narrative continues
Market Participation Broadened: More stocks are participating in the S&P 500’s latest march to record highs (43 new all-time highs in 2024), easing concerns over a rally that has been concentrated in a handful of giant technology names for much of 2024. More than 60% of S&P 500 components have outperformed the index in Q3, compared to around 25% in the first half of the year. The equal-weight version of the S&P 500 – a proxy for the average index stock – has gained almost 9.5% in the quarter, outperforming the S&P 500, which is more influenced by the heavily weighted shares of mega caps (NVDA, AAPL, MSFT, META, etc.). The broadening rally is an encouraging sign for stocks, following concerns that the market could be vulnerable to a reversal if the cluster of tech names propping it up fell out of favor. This is a healthy development for risk assets.
The Best Quarter for Bonds since Q4 2023 – A Bond Market Review: The Bloomberg Aggregate Bond Index rose 5.20%. Rates dropped sharply at the start of Q3, as the market began to anticipate the start of the rate-cutting cycle. The 10-year Treasury dropped 0.65% (to 3.74%) and the 2-year Treasury fell 1.14% (to 3.62%). Aside from a brief credit disturbance during the Yen Carry Trade episode in early August, credit spreads remained resilient and stable.
Fed in Focus: The economy has performed better than most expected which suggests the Fed could have had room to cut rates more gradually than the recent 50bp move. The larger-than-expected rate cut suggests that the FOMC is trying to be more preemptive rather than passive in responding to signs of a cooling labor market. This makes sense given how far the Fed Funds Rate (“FFR”) is above what the Fed thinks is the neutral rate of 2.5% – 3.0%.
Let’s Talk About the Consumer: A lot of people need to read this statement on the consumer: The market is over-supplied with high-frequency information from US retail companies; it can’t be that every micro data point is taken as a referendum on the macro state of the US consumer. From a higher level, many of us know that over 2/3rds of U.S. GDP is driven by the consumer. If you are tracking the estimates for U.S. real GDP continue to indicate healthy growth. Economic growth supports growth in corporate profits. If profits are expanding, it’s tough to get in big trouble.
-
- US Savings Rate Has Been Updated: Simply said, the US Savings rate is not as low as the initial reports may suggest. US consumer saving rates from July were first reported to be 2.9% but were later revised higher to 4.9%, and we think it still is not properly accounting for consumer strength. August’s report came in at 4.8%. One factor that is largely underappreciated in consumer savings rate calculations is that it only accounts for the nominal dollar amount saved but does not accurately account for the return on those savings. Higher yields in money markets and savings accounts can help to serve as a buffer to consumer spending downside.
The Challenge For Earnings: Expectations for 2025 are for margins to reach a record high of 13.9%, more than 1% higher than any margin point in the last 35 years. The previous high was 12.4% in 2021, during a period of reduced costs due to economic closures and government stimulus. Meeting these higher margins amid rising costs will be a challenge moving forward.
The Presidential Election Year: Since ‘44, the S&P 500 has not declined in a year in which an incumbent president was running for re-election (avg. return of 16%). Stocks have declined in presidential election years, but in each of those cases, it was a year in which there was an open election with no incumbent running (‘60, ‘00, and ‘08). Presidents want to be re-elected and will use whatever policy levers are needed to boost the US economy. In fact, every president who avoided a recession two years before their re-election went on to win the election. And every president who had a recession in the two years before their re-election went on to lose. As of July, the incumbent is no longer running for president, but that doesn’t mean that the tool chest of liquidity will not be utilized to insulate the market, in case volatility shows its unwelcomed face.
A Bond Statistic that May Surprise Investors: Investors should be mindful that long duration exposure comes with equity-like volatility, with 9 of the last 12 years seeing long duration Treasuries post a larger intra-year decline than the S&P 500.
S&P 500 EPS: ’25 (Exp.) EPS = $278. ‘24 EPS = $242 (+14.8%). 2023 = $220 (+10.0%). 2022 = $219 (+0.5%). 2021 = $204.*
Valuations: S&P 500 Fwd. P/E (NTM): 21.7x, EAFE: 14.4x, EM: 12.5x, R1V: 17.2x, and R1G: 28.1x. *
*Source: Bloomberg and FactSet, Data as of 09/30/24
Disclosures
Aptus Capital Advisors, LLC is a Registered Investment Advisor (RIA) registered with the Securities and Exchange Commission and is headquartered in Fairhope, Alabama. Registration does not imply a certain level of skill or training. For more information about our firm, or to receive a copy of our disclosure Form ADV and Privacy Policy call (251) 517-7198 or contact us here. Information presented on this site is for educational purposes only and does not intend to make an offer or solicitation for the sale or purchase of any securities.
This commentary offers generalized research, not personalized investment advice. It is for informational purposes only and does not constitute a complete description of our investment services or performance. Nothing in this commentary should be interpreted to state or imply that past results are an indication of future investment returns. All investments involve risk and unless otherwise stated, are not guaranteed. Be sure to consult with an investment & tax professional before implementing any investment strategy.
Past performance is not indicative of future results. This material is not financial advice or an offer to sell any product. The information contained herein should not be considered a recommendation to purchase or sell any particular security. Forward looking statements cannot be guaranteed.
The S&P 500® is widely regarded as the best single gauge of large-cap U.S. equities. There is over USD 11.2 trillion indexed or benchmarked to the index, with indexed assets comprising approximately USD 4.6 trillion of this total. The index includes 500 leading companies and covers approximately 80% of available market capitalization.
The Nasdaq Composite Index measures all Nasdaq domestic and international based common type stocks listed on The Nasdaq Stock Market. To be eligible for inclusion in the Index, the security’s U.S. listing must be exclusively on The Nasdaq Stock Market (unless the security was dually listed on another U.S. market prior to January 1, 2004 and has continuously maintained such listing). The security types eligible for the Index include common stocks, ordinary shares, ADRs, shares of beneficial interest or limited partnership interests and tracking stocks. Security types not included in the Index are closed-end funds, convertible debentures, exchange traded funds, preferred stocks, rights, warrants, units and other derivative securities.
The Dow Jones Industrial Average® (The Dow®), is a price-weighted measure of 30 U.S. blue-chip companies. The index covers all industries except transportation and utilities.
The MSCI EAFE Index is an equity index which captures large and mid-cap representation across 21 Developed Markets countries*around the world, excluding the US and Canada. With 902 constituents, the index covers approximately 85% of the free float-adjusted market capitalization in each country.
The MSCI Emerging Markets Index captures large and mid-cap representation across 26 Emerging Markets (EM) countries*. With 1,387 constituents, the index covers approximately 85% of the free float-adjusted market capitalization in each country.
Investment-grade Bond (or High-grade Bond) are believed to have a lower risk of default and receive higher ratings by the credit rating agencies. These bonds tend to be issued at lower yields than less creditworthy bonds.
Non-investment-grade debt securities (high-yield/junk bonds) may be subject to greater market fluctuations, risk of default or loss of income and principal than higher-rated securities.
Nasdaq-100® includes 100 of the largest domestic and international non-financial companies listed on the Nasdaq Stock Market based on market capitalization.
The Bloomberg Barclays U.S. Aggregate Bond Index is a broad-based benchmark that measures the investment grade, U.S. dollar-denominated, fixed-rate taxable bond market. This includes Treasuries, government-related and corporate securities, mortgage-backed securities, asset-backed securities, and collateralized mortgage-backed securities. ACA-2410-2.
