Developments Over the Past Month
As the summer comes to a close, it’s worth looking back to Memorial Day for perspective. Equities have been largely flattish and extremely volatile since late May, credit spreads have been flattish, bond yields have trended higher and the curve has become increasingly inverted. We expect more volatility as we enter Fall and Winter, as we suspect earnings expectations will start weakening more severely, offset by inflation headlines/central bank hawkishness weakening.
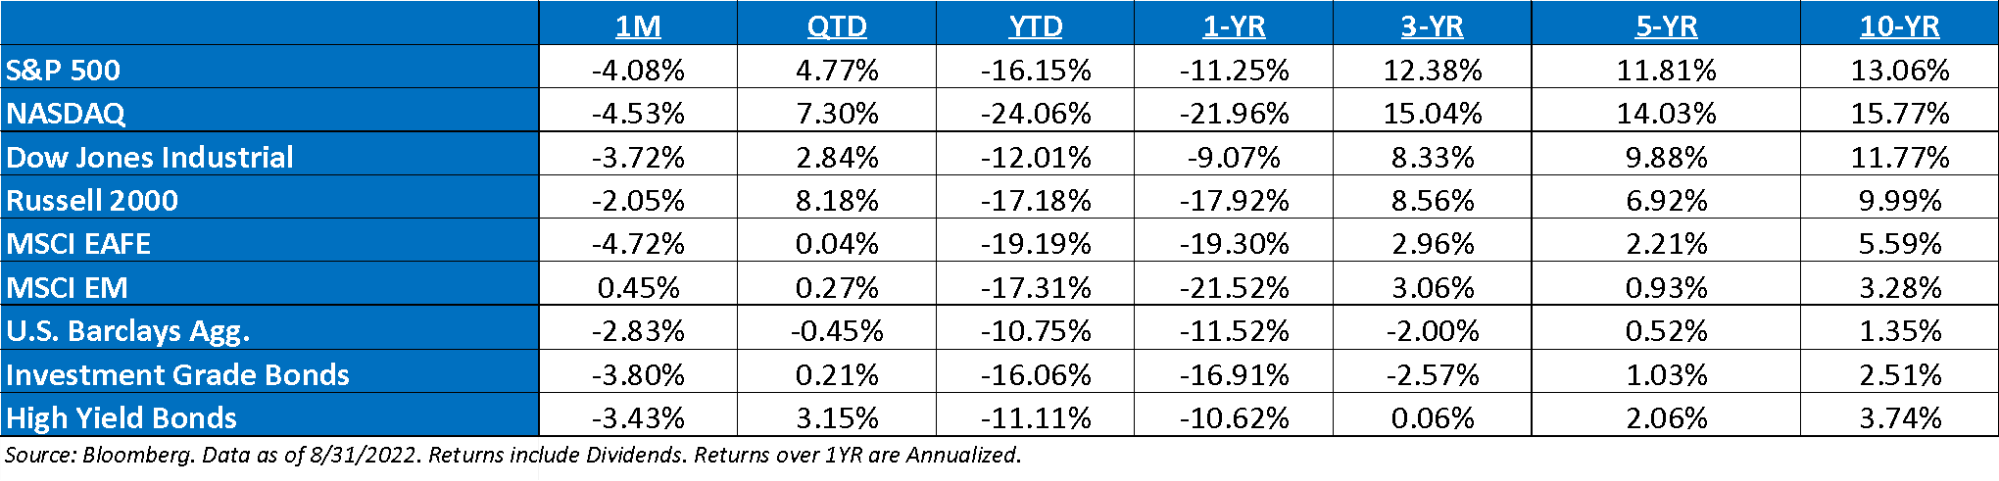
No Help from Bond Markets: The pain in the bond market largely continued in August, with the U.S. Aggregate Index now down almost 11% year-to-date. Since the late 1970s, no other year has come close to experiencing similar pain in the bond market. U.S. bonds are now 12.4% off their peak. Except for the drawdown that ended in February 1980 (when the index was only calculated monthly), this is almost twice as large as the next biggest drawdown on record. Global bonds have fared even worse. In total, the drawdown in global bonds has now reached almost 20%. Since data began in 1989, this is almost twice as large as the next biggest drawdown on record.
Action Jackson Hole: Consider the punch bowl removed. Fed Chair Powell spoke about fighting inflation in his Jackson Hole speech, saying “we must keep at it until the job is done.” Honestly, we don’t know what the Fed could realistically say that’s more hawkish than evoking Paul Volcker language. But the FOMC has a broader focus than just “peak”. True, the slowdown in inflation means the pace of rate hikes does not have to continue at the +75bp aggressive clip of the past two FOMC meetings, especially with Quantitative Tightening (QT) ramping up. Yet the Fed should not pursue a stop-and-go strategy – this was a mistake in the 1970s that did not work out well (i.e., it led to stagflation). The FOMC knows this. Powell noted in his speech last week that “the historical record cautions strongly against prematurely loosening policy.” The “unconditional” pursuit of price stability may indeed cause economic “pain,” but that was understood and considered worth it.
Bear Market Bounce or is the Bottom in? The debate about the future direction of the market is heating up. We’ve now seen 4 bear market rallies this year. One of the observations that we’ve seen in recent months is that bear market rallies grow larger as the bear market grows older. Whether the Fed is close to finishing tightening, or they are cutting rates, we imagine that every bear market rally during past bear markets (2000-03, 2007-09) generates the “it’s the bottom” conversation every time – this time is no different.
Where is The Fed Put? We continue to believe that the Fed Put is much lower right now, as FOMC Chairman Jerome Powell, has stated that the Fed is going to keep raising until we have a recession unless inflation meaningfully improves. The cause of the decline is equally important. The Fed has a long history of easing policy in response to earnings drops, but there isn’t much evidence that it responds to multiple compression. The fact that inflation is higher than at any time since the genesis of the Fed Put and that stocks have appreciated a lot over the past two years suggest the strike is well below current prices. Similarly, the recent decline in stock prices owes exclusively to lower multiples; it would take another leg down induced by a drop in earnings to impress the Fed.
“Phantom Earnings” Moving Forward: Overall, 2022 consensus EPS are up modestly, but what is most noteworthy is how this earnings trend has skewed between indexes with small-cap and value indexes seeing much more significant positive earnings revisions, while growth and larger-cap indexes, more negative. We remain skeptics that the current 2023 earnings expectations for the S&P 500 remain too high. On average, earnings, as a whole, tend to fall between 15% – 20%, of which, earnings are only 3% off their highs.
Earnings Season: Overall earnings season has shown signs of improvement, much better than anticipated by many economists. Of the companies that have reported, S&P 500 year-over-year earnings growth now stands at +7.9%, with revenue growth increasing +12.1%. Looking at S&P 500 EPS and S&P 500 Ex-Energy EPS shows just how significant of a contribution the sector made during the second quarter. The Q2 reading would have been nearly $8 less if it weren’t for energy’s contribution. With a 16% earnings contribution weight and only a 4% market cap weight for the second quarter, it becomes evident that the energy sector is boosting corporate profits.
S&P Valuation: The S&P 500 slightly decreased, along with the market in August, now trading at 17.3x (18.1x last month) or 2 turns higher than where it was trading at in the middle of June. This seems hard to justify given the growing concern about earnings. As a result, we continue to believe any near-term rally is nothing more than a bear market bounce with lower lows ahead.
Earnings: 2022 S&P 500 operating earnings = $225 (+10.3%). 2023 = $244 (+8.4%). 2021 = $204. 2020 = $136. 2019 = $161. *
Valuations: S&P 500 Fwd. P/E: 17.3x, EAFE: 11.7x, EM: 10.7x, R1V: 13.4x, R1G: 23.4x, and R2K: 11.7x. *
*Source: Bloomberg and FactSet, Data as of 8.31.22
Disclosures
Aptus Capital Advisors, LLC is a Registered Investment Advisor (RIA) registered with the Securities and Exchange Commission and is headquartered in Fairhope, Alabama. Registration does not imply a certain level of skill or training. For more information about our firm, or to receive a copy of our disclosure Form ADV and Privacy Policy call (251) 517-7198 or contact us here. Information presented on this site is for educational purposes only and does not intend to make an offer or solicitation for the sale or purchase of any securities.
This commentary offers generalized research, not personalized investment advice. It is for informational purposes only and does not constitute a complete description of our investment services or performance. Nothing in this commentary should be interpreted to state or imply that past results are an indication of future investment returns. All investments involve risk and unless otherwise stated, are not guaranteed. Be sure to consult with an investment & tax professional before implementing any investment strategy.
Past performance is not indicative of future results. This material is not financial advice or an offer to sell any product. The information contained herein should not be considered a recommendation to purchase or sell any particular security. Forward looking statements cannot be guaranteed.
The S&P 500® is widely regarded as the best single gauge of large-cap U.S. equities. There is over USD 11.2 trillion indexed or benchmarked to the index, with indexed assets comprising approximately USD 4.6 trillion of this total. The index includes 500 leading companies and covers approximately 80% of available market capitalization.
The Nasdaq Composite Index measures all Nasdaq domestic and international based common type stocks listed on The Nasdaq Stock Market. To be eligible for inclusion in the Index, the security’s U.S. listing must be exclusively on The Nasdaq Stock Market (unless the security was dually listed on another U.S. market prior to January 1, 2004 and has continuously maintained such listing). The security types eligible for the Index include common stocks, ordinary shares, ADRs, shares of beneficial interest or limited partnership interests and tracking stocks. Security types not included in the Index are closed-end funds, convertible debentures, exchange traded funds, preferred stocks, rights, warrants, units and other derivative securities.
The Dow Jones Industrial Average® (The Dow®), is a price-weighted measure of 30 U.S. blue-chip companies. The index covers all industries except transportation and utilities.
The Russell 2000® Index measures the performance of the small-cap segment of the US equity universe. The Russell 2000® Index is a subset of the Russell 3000® Index representing approximately 10% of the total market capitalization of that index. It includes approximately 2,000 of the smallest securities based on a combination of their market cap and current index membership. The Russell 2000® is constructed to provide a comprehensive and unbiased small-cap barometer and is completely reconstituted annually to ensure larger stocks do not distort the performance and characteristics of the true small-cap opportunity set.
The MSCI EAFE Index is an equity index which captures large and mid-cap representation across 21 Developed Markets countries*around the world, excluding the US and Canada. With 902 constituents, the index covers approximately 85% of the free float-adjusted market capitalization in each country.
The MSCI Emerging Markets Index captures large and mid-cap representation across 26 Emerging Markets (EM) countries*. With 1,387 constituents, the index covers approximately 85% of the free float-adjusted market capitalization in each country.
Investment-grade Bond (or High-grade Bond) are believed to have a lower risk of default and receive higher ratings by the credit rating agencies. These bonds tend to be issued at lower yields than less creditworthy bonds.
Non-investment-grade debt securities (high-yield/junk bonds) may be subject to greater market fluctuations, risk of default or loss of income and principal than higher-rated securities.
Nasdaq-100® includes 100 of the largest domestic and international non-financial companies listed on the Nasdaq Stock Market based on market capitalization.
The Bloomberg Barclays U.S. Aggregate Bond Index is a broad-based benchmark that measures the investment grade, U.S. dollar-denominated, fixed-rate taxable bond market. This includes Treasuries, government-related and corporate securities, mortgage-backed securities, asset-backed securities and collateralized mortgage-backed securities. ACA-2209-2.
