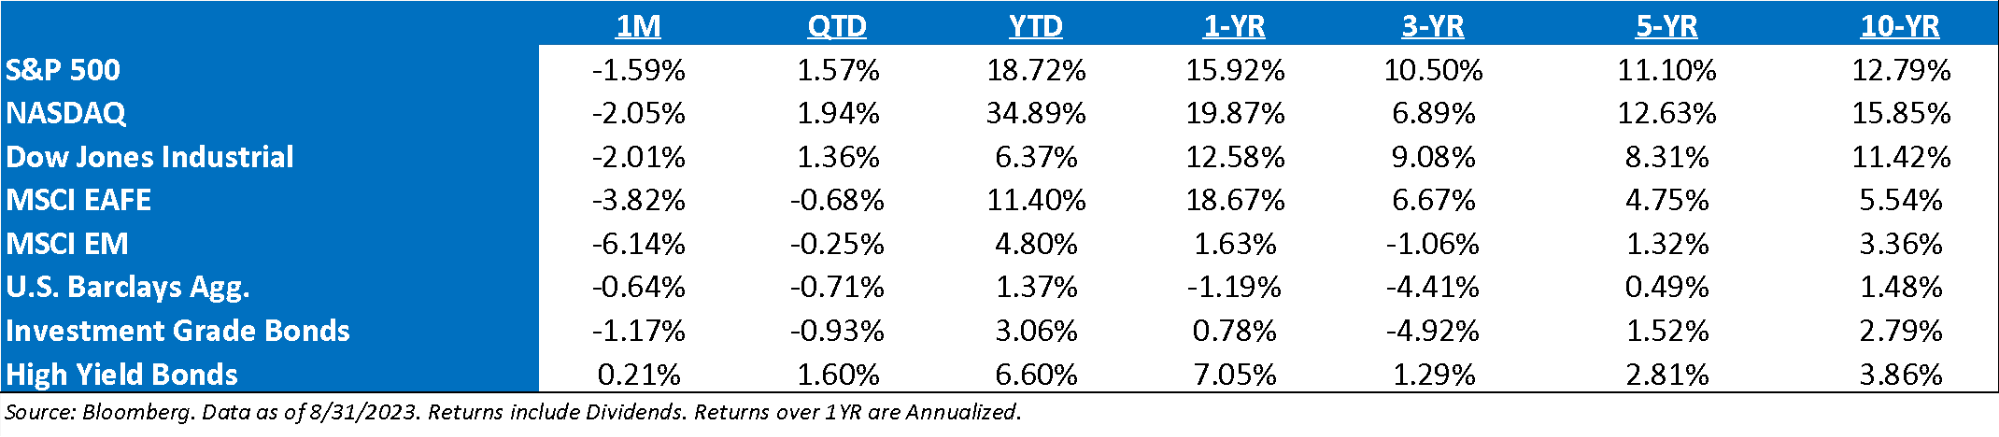
August ‘23 Market Recap: The S&P 500 reversed course in August, falling 1.6% after jumping 10% in June-July on a total return basis. Higher rates, more positioning risk, and seasonality were likely headwinds to equities, despite solid macro data and earning. Breadth narrowed again for the second straight month (42% of stocks outperformed vs. 47% in July and 49% historical average), and the equal-weighted S&P 500 underperformed the cap-weighted index (-3.2% vs. -1.6%). All major assets fell except cash (+0.5%): long-term Treasuries -2.7%, investment-grade corp. bonds -0.7%, and gold -1.1%. International stocks underperformed US stocks both in local currency terms (-2.6%) and in USD terms (-4.5%), dragged down by emerging markets (-4.7% in local currency & -6.1% in USD).
Looking at History: With a 17.4% price return through August, the rolling 8-month % change for the S&P 500 ranks in the top quintile over the last 80+ years of data. While returns might be less impressive over the next 8 months, they still tend to skew favorably with decent hit rates. From a seasonality perspective, Aug-Sept marks one of the seasonally weakest periods for stocks. Since 1936, the S&P 500 was flat on average in September, rising just 55% of the time vs. 63% on average (second weakest after Feb). But Q4 has been the strongest quarter, gaining 4.6% on average with returns positive 81% of the time vs 66% for the other three quarters.
Globally, YTD Equity Performance Has Been Dramatically US-Biased, But Mostly In First 5 Months: The first 5 months of the year were heavily US-biased as the equity market seemed to price in most of the China recovery weakness and perceived AI benefit to US equities (megacap tech). Performance this summer was more mixed, as the US continued to lead performance (with broader cyclical sectors outperforming), while most other country indexes treaded water as global investors seemed to ebb and flow between weak China data, and likely China stimulus all summer.
Earnings Season: Though off of the highs forecasted roughly a year ago, ‘23 EPS estimates have turned up slightly, encouraging equity markets to trade higher. However, it seems that few institutional investors are buying into this reversing trend, choosing instead to camp out in the largest, most liquid, profitable names that have worked year-to-date. This is proving to further exacerbate the lack of market breadth. With marginal improvement during the reporting season, the annual 2023 EPS figure has moved higher by more than $3 from its lowest levels. What remains remarkable is that the consensus continues to believe that earnings growth in 2024 will be more than 12% while at the same time management has been rather reserved in their guidance for next year. As for this year, we have seen many companies guide as economic growth remains resilient.
August Nonfarm Payrolls: The recent NFP Jobs Report was essentially in line with expectations at 187k, with the unemployment rate rising to 3.8% from 3.5% as the government’s measure of labor participation increased (we hesitate to say that true labor force participation changed that materially in one month time). Net/Net, there’s probably been more workers available this whole time than the government estimated, which explains why wages have largely been coming down even as the job market has tightened since early ’22. That said, avg. hourly earnings are coming down very slowly, and are still ~1% above levels consistent with 2% inflation.
Jackson Hole Recap: Fed Chair Powell delivered what we thought was a balanced assessment of the economic and monetary policy outlook at Jackson Hole today. As expected, he gave little forward guidance on policy, instead emphasizing data dependence. There were a few hawkish elements in Powell’s speech. First, he mentioned that the Fed is vigilant to the risk that the economy is not slowing as expected, particularly given the recent robust data. Therefore, further tightening could be warranted. Second, Powell reiterated the Fed’s view that a period of below-trend growth and a softer labor market would be needed to get inflation back to 2%. In other words, the Fed does not believe in immaculate disinflation.
What Concerns Us the Most: In short: 1) Continued volatility; 2) Inflation transitions to growth frustration; 3) The potential for a Fed policy error and continued collateral damage; 4) A general tendency to think about the economy and stock prices in V-shaped terms, i.e., a Fed Pivot saving the day.
Thoughts Around Inflation: The inflation trend looks great, especially if one excludes shelter, even before any meaningful labor market softening has occurred. Inflation is simple now – +0.2% M/M gains until year end would get us below 3% headline and 2% Core by end of year. An average monthly report of 0.3% or higher keeps us above 3% on both. So, 0.2% and the disinflation camp wins, 0.3% and the sticky inflation camp wins. Right now, the disinflation camp looks like it’s winning, but changes in medical inflation calculations (10% of core CPI) will serve as a headwind starting in October, while commodities are the risk to this – which are up 10% since May.
Earnings: ‘23 S&P 500 op. earnings = $222 (+1.4%). 2022 = $219 (+7.4%). 2021 = $204. 2020 = $136. 2019 = $161. *
Valuations: S&P 500 Fwd. P/E (NTM): 22.1x, EAFE: 13.8x, EM: 13.1x, R1V: 16.7x, R1G: 30.8x, and R2K: 16.3x.*
*Source: Bloomberg and FactSet, Data as of 8/31/23
Disclosures
Aptus Capital Advisors, LLC is a Registered Investment Advisor (RIA) registered with the Securities and Exchange Commission and is headquartered in Fairhope, Alabama. Registration does not imply a certain level of skill or training. For more information about our firm, or to receive a copy of our disclosure Form ADV and Privacy Policy call (251) 517-7198 or contact us here. Information presented on this site is for educational purposes only and does not intend to make an offer or solicitation for the sale or purchase of any securities.
This commentary offers generalized research, not personalized investment advice. It is for informational purposes only and does not constitute a complete description of our investment services or performance. Nothing in this commentary should be interpreted to state or imply that past results are an indication of future investment returns. All investments involve risk and unless otherwise stated, are not guaranteed. Be sure to consult with an investment & tax professional before implementing any investment strategy.
Past performance is not indicative of future results. This material is not financial advice or an offer to sell any product. The information contained herein should not be considered a recommendation to purchase or sell any particular security. Forward looking statements cannot be guaranteed.
The S&P 500® is widely regarded as the best single gauge of large-cap U.S. equities. There is over USD 11.2 trillion indexed or benchmarked to the index, with indexed assets comprising approximately USD 4.6 trillion of this total. The index includes 500 leading companies and covers approximately 80% of available market capitalization.
The Nasdaq Composite Index measures all Nasdaq domestic and international based common type stocks listed on The Nasdaq Stock Market. To be eligible for inclusion in the Index, the security’s U.S. listing must be exclusively on The Nasdaq Stock Market (unless the security was dually listed on another U.S. market prior to January 1, 2004 and has continuously maintained such listing). The security types eligible for the Index include common stocks, ordinary shares, ADRs, shares of beneficial interest or limited partnership interests and tracking stocks. Security types not included in the Index are closed-end funds, convertible debentures, exchange traded funds, preferred stocks, rights, warrants, units and other derivative securities.
The Dow Jones Industrial Average® (The Dow®), is a price-weighted measure of 30 U.S. blue-chip companies. The index covers all industries except transportation and utilities.
The MSCI EAFE Index is an equity index which captures large and mid-cap representation across 21 Developed Markets countries*around the world, excluding the US and Canada. With 902 constituents, the index covers approximately 85% of the free float-adjusted market capitalization in each country.
The MSCI Emerging Markets Index captures large and mid-cap representation across 26 Emerging Markets (EM) countries*. With 1,387 constituents, the index covers approximately 85% of the free float-adjusted market capitalization in each country.
Investment-grade Bond (or High-grade Bond) are believed to have a lower risk of default and receive higher ratings by the credit rating agencies. These bonds tend to be issued at lower yields than less creditworthy bonds.
Non-investment-grade debt securities (high-yield/junk bonds) may be subject to greater market fluctuations, risk of default or loss of income and principal than higher-rated securities.
Nasdaq-100® includes 100 of the largest domestic and international non-financial companies listed on the Nasdaq Stock Market based on market capitalization.
The Bloomberg Barclays U.S. Aggregate Bond Index is a broad-based benchmark that measures the investment grade, U.S. dollar-denominated, fixed-rate taxable bond market. This includes Treasuries, government-related and corporate securities, mortgage-backed securities, asset-backed securities, and collateralized mortgage-backed securities. ACA-2309-2.
