Back to the Basics
Sometimes, the most powerful illustration of a concept is simple math…
Let’s imagine having four portfolios to choose from over the next five years. Each will have three good years and two not so good.
Here’s a table of the annual returns of each portfolio. Which do you choose?
 Information presented above is for illustrative purposes only and should not be interpreted as actual performance of any investor’s account. These figures are entirely assumed to illustrate the concept of varying portfolio outcomes. As these are not actual results and completely assumed, they should not be relied upon for investment decisions. Actual results of individual investors will differ due to many factors, including individual investments and fees, client restrictions, and the timing of investments and cash flows.
We’ve highlighted Portfolio B because…it’s noticeably boring…the best return is a measly 7%, who’d pick that one?
Average Return vs Compound Return
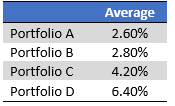
Maybe you thought to just average up the numbers to get the right answer. Let’s do that:
 Information presented above is for illustrative purposes only and should not be interpreted as actual performance of any investor’s account. These figures are entirely assumed to illustrate the concept of varying portfolio outcomes. As these are not actual results and completely assumed, they should not be relied upon for investment decisions. Actual results of individual investors will differ due to many factors, including individual investments and fees, client restrictions, and the timing of investments and cash flows.
From that angle, clearly Portfolio D is the right answer…right? Wrong.
Imagine an investment that goes up 20% in the first year and down 20% in the second. The average return is 0%. The ‘compound return’ is negative 2% per year. $100 growing by 20% in year one closes the year at $120. $120 losing 20% in year two is a drop to $96.
The important takeaway – Your portfolio doesn’t grow by average returns, it grows by compound returns. Average returns are plagued by overemphasis of the good and underemphasis of the bad. The effects of this are average returns can never be less than compound returns (again, compound returns are all that matters).
In the simple +20, -20 example above, the average was 0% while the compound return was -2%. Last point to make before we move on…
Now consider +10% in year one and -10% in year 2 – the average is still 0% but the compound return is -0.5% per year.
While the compound return is still lower, the gap between the average and the compound return is less, and it’s the gap that matters. Hopefully, you see where we are going with this.
This gap can be defined as the volatility tax, a term we picked up from Mark Spitznagel. The more volatile a return stream is, the greater the gap between average return and compound return will be. This is an important concept to be aware of, as the impact to compounding capital is crucial.
Boring Wins the Race
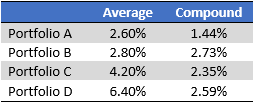
Back to our portfolios, let’s look at which portfolio compounds the fastest.
 Information presented above is for illustrative purposes only and should not be interpreted as actual performance of any investor’s account. These figures are entirely assumed to illustrate the concept of varying portfolio outcomes. As these are not actual results and completely assumed, they should not be relied upon for investment decisions. Actual results of individual investors will differ due to many factors, including individual investments and fees, client restrictions, and the timing of investments and cash flows.
The boring portfolio wins. How could that be? The math of compound returns with the low volatility drag…that’s how.
The table below has been expanded to include both the average returns and the compound return per year.
 Information presented above is for illustrative purposes only and should not be interpreted as actual performance of any investor’s account. These figures are entirely assumed to illustrate the concept of varying portfolio outcomes. As these are not actual results and completely assumed, they should not be relied upon for investment decisions. Actual results of individual investors will differ due to many factors, including individual investments and fees, client restrictions, and the timing of investments and cash flows.
Notice that Portfolio B has two things:
- The highest Compound Return, therefore, the highest ending value.
- The smallest gap between average and compound. In other words, a lower volatility tax.
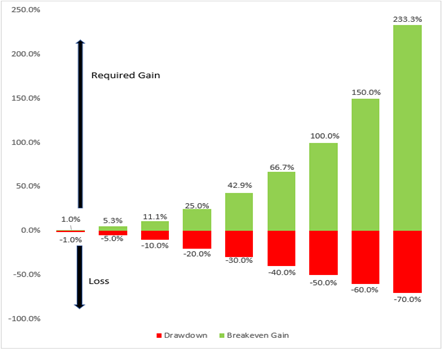
The takeaway – Don’t Drawdown!
 Source: Aptus. Information presented above is for illustrative purposes only and should not be interpreted as actual performance of any investor’s account. These figures are entirely assumed to illustrate the concept of varying portfolio drawdown impacts. As these are not actual results and completely assumed, they should not be relied upon for investment decisions. Actual results of individual investors will differ due to many factors, including individual investments and fees, client restrictions, and the timing of investments and cash flows.
Drawdowns crush your ability to compound capital. We cannot stress the point enough.
Drawdowns are a tax, friction, hindrance, etc. to the ability to compound capital.
Good returns are important but managing risk to limit drawdowns matters more.
Your Objectives
The math is simple, and the implications are obvious. If your objective is to grow and protect wealth your focus should be on risk first and returns second.
Boring gets the job done if risks are managed appropriately.
I’m not saying we don’t want return, of course we do. I’m simply reminding us that large returns carry baggage. That baggage is the potential for large losses and large losses are compound returns’ kryptonite.
This Market and Your Portfolios
It’s our job to sufficiently compound capital. Success doesn’t require astronomical numbers. It requires sufficient returns and limiting large losses. I’m hopeful the simple examples above illustrated this point. This should be an uplifting thought when you consider the return reality moving forward.
Our options to generate return are found in either stocks, bonds, or cash.
Let’s start with bonds & cash. Our portfolios have minimal exposure to these as return drivers and here’s why:
We are currently in an inflationary environment, and we aren’t sure when that will change. CPI (an index designed to measure inflation) is running at an annualized rate of 6.48% for the first 9 months of 2021. We’d argue inflation is even higher than stated by CPI, but we will be conservative and use that 6.48% number for our example.
The current 10-year Treasury bond is paying ~1.60%. This means, holding other factors constant, a 10-year bond carries a NEGATIVE real annual return of (1.60% – 6.48%) equals -4.88%. Bond holders are losing 4.88% of the value of their money each year.
If inflation is actually higher than CPI indicates, this means this number is even more negative.
This is called going broke slowly, and this is the risk the asset class known for conservative characteristics is injecting into retirement portfolios all over.
We often refer to the power of compounding and given enough time, that power can turn small numbers into large numbers. We can’t forget, the math works the same way when those compound returns are negative – it gets ugly quickly.
$100 dollars compounding at negative 4.88% for 5 years turns into about $77.86. That’s a 22%+ loss on your ‘safe’ money. Ouch.
Translation – we don’t own many bonds!
We continue to believe our returns will come from stocks, and our shift away from bonds and towards stocks won’t change anytime soon. We hold more stocks and less bonds than we typically would across all risk levels. To address the added stock exposure, this shift has been accompanied by exposure to volatility.
Handling the Curves
Stocks are the engine. Convex payouts from volatility are the brakes. Let me explain with a simple analogy we read from David Dredge of Convex Strategies:
Formula One racing is all about the brakes. Speed and power are the attention grabbers, but the brakes win the race. Being able to decelerate quickly is a separator.
In our portfolios, we’ve improved the engine and our speed by owning more stocks and less bonds. This engine should have a greater chance of generating returns.
We are protecting the vehicle with our hedging and long volatility exposure. They are the brakes. Returns should be solid because our engines are strong, but the math dictates the critical nature of good brakes. We must be able to decelerate quickly during market volatility.
Accomplishing long-term portfolio objectives is not just about speed on the straight away. It’s as much about being ready to handle the curves along the way.
Conclusion
To grow and protect your portfolios, we aim for limited drawdowns. It’s not our objective, nor should it be, to beat the S&P quarter in and quarter out. With the right engine and brakes in place, our chance of success increases with every lap. Even if it looks boring along the way.
We are searching for return, always, while keeping an even closer eye on risk – nothing detrimental. Boring and resilient are adjectives we’d love to claim for our portfolios as those words describe a portfolio built for success.
As always, thank you for your trust and don’t hesitate to reach out with any questions.
Disclosures
Past performance is not indicative of future results. This material is not financial advice or an offer to sell any product. The information contained herein should not be considered a recommendation to purchase or sell any particular security. Forward looking statements cannot be guaranteed.
This commentary offers generalized research, not personalized investment advice. It is for informational purposes only and does not constitute a complete description of our investment services or performance. Nothing in this commentary should be interpreted to state or imply that past results are an indication of future investment returns. All investments involve risk and unless otherwise stated, are not guaranteed. Be sure to consult with an investment & tax professional before implementing any investment strategy. Investing involves risk. Principal loss is possible.
Advisory services offered through Aptus Capital Advisors, LLC, a Registered Investment Adviser registered with the Securities and Exchange Commission. Registration does not imply a certain level or skill or training. More information about the advisor, its investment strategies and objectives, is included in the firm’s Form ADV Part 2, which can be obtained, at no charge, by calling (251) 517-7198. Aptus Capital Advisors, LLC is headquartered in Fairhope, Alabama. ACA-2111-2.


