Our team looks at a lot of research throughout each day. A few charts that caught our eye this week, and the way they fit the unfolding puzzle of evidence:
Dave: As everyone knows, a tiny group of megacap tech carried stocks on their back into early June
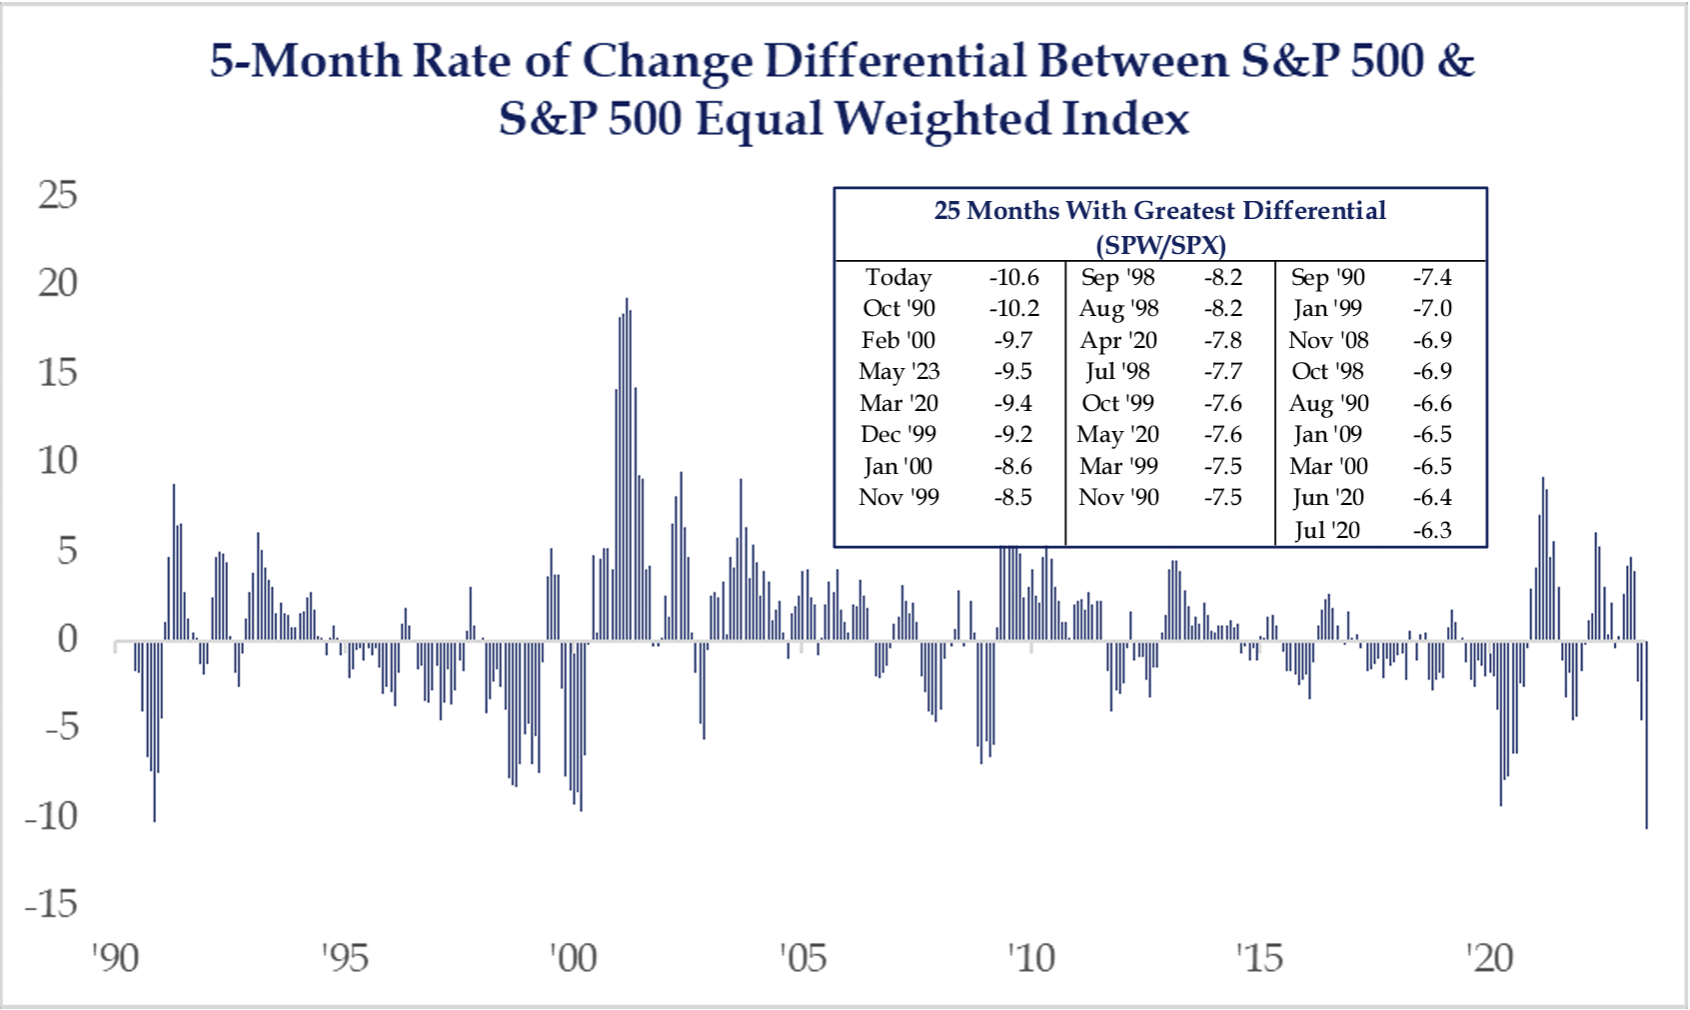 Source: Strategas as of 06.02.2023
Beckham: with a massive performance disparity between the top few names and the rest
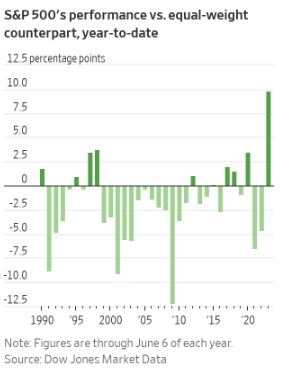 Source: WSJ as of 06.07.2023
Dave: but could the divergence just get worked off through a broader advance, vs. a major S&P decline?
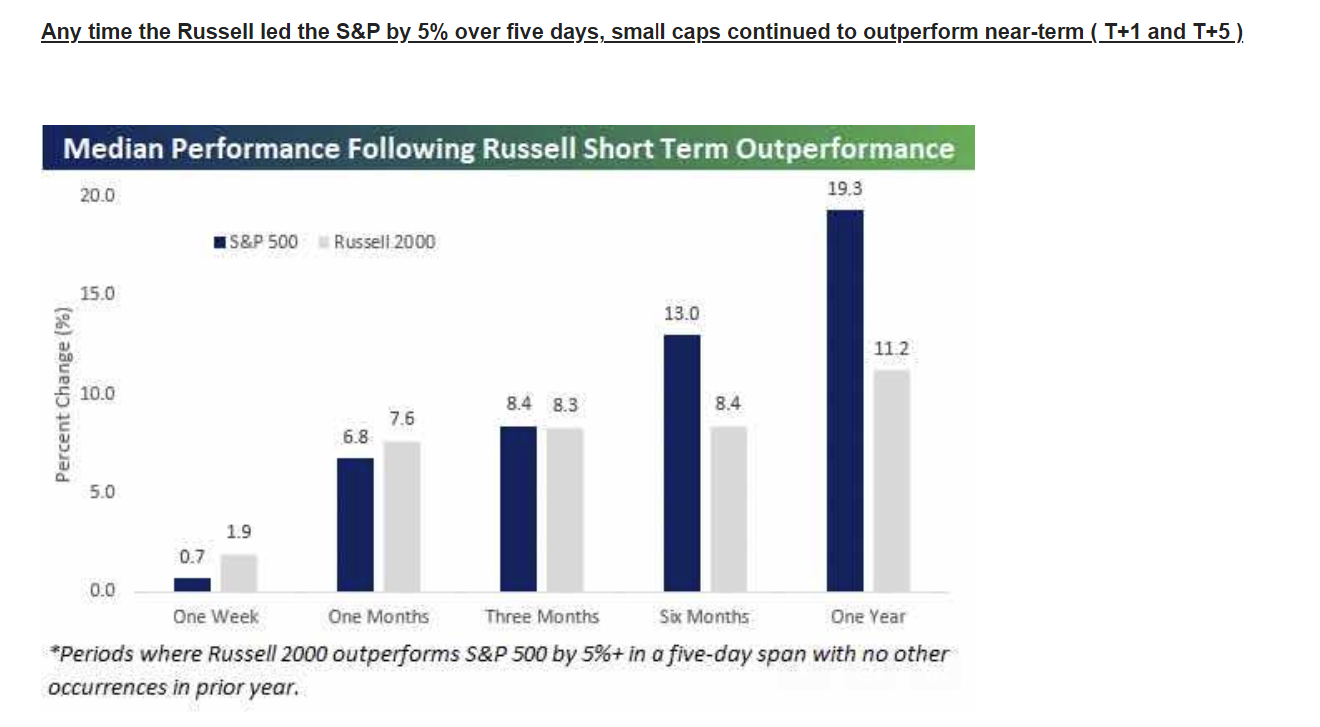 Source: Mizuho as of 06.08.2023
Joseph: The rate hiking cycle since early 2022 has seen pockets of performance differences
 Source: Bespoke as of 06.02.2023
Brad: but it’s in lower volatility environments where we’ve historically seen even larger disparities
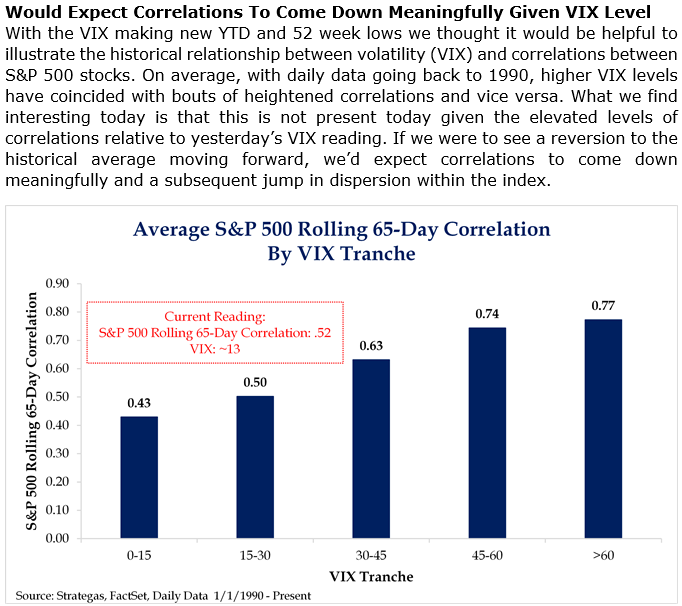 Source: Strategas as of 06.06.2023
John Luke: Money has been flying into the safest areas of markets
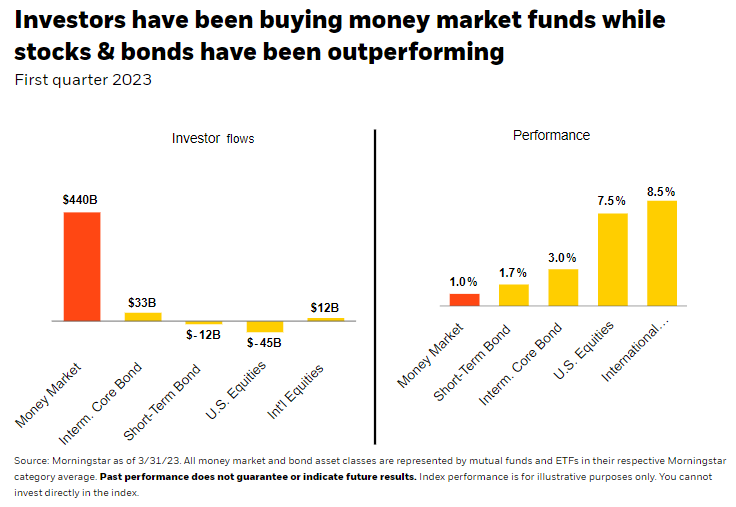 Source: BlackRock as of April 2023
Derek: which may set up some conflicts if investors get confident enough to start shoveling that money back into stocks
 Data as of April 2023
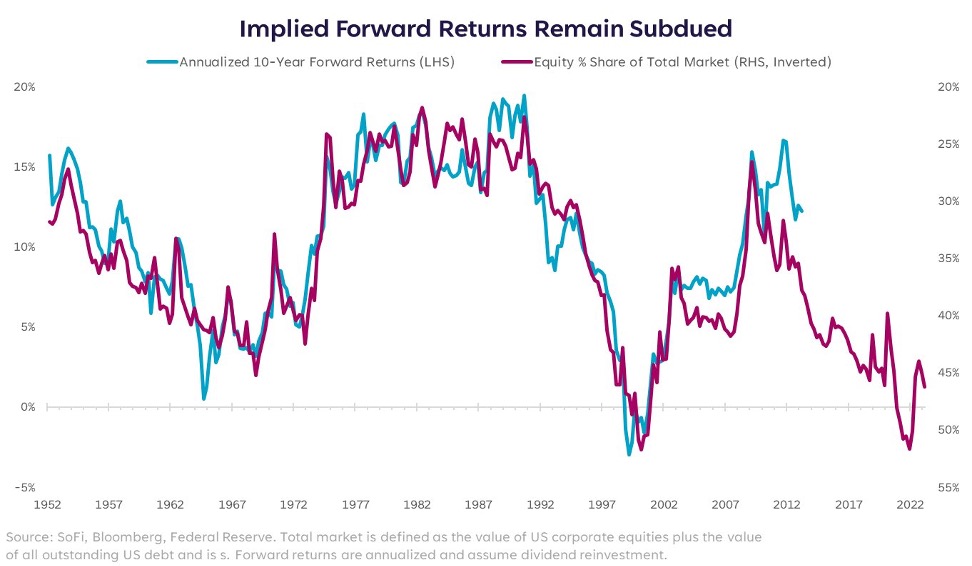
Brad: S&P 500 valuations aren’t overly inspiring from an index level of 4300
 Source: Sevens Report as of 06.05.2023
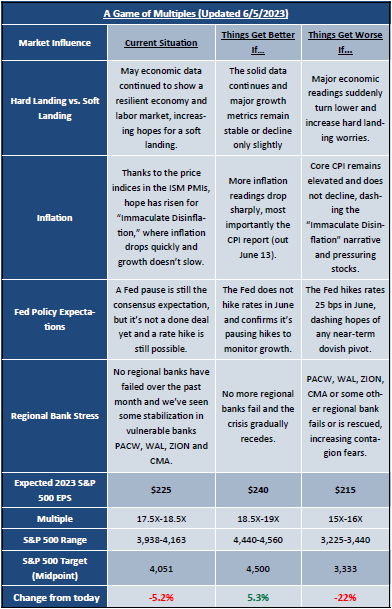
Dave: particularly if Morgan Stanley’s concerns about earnings come through
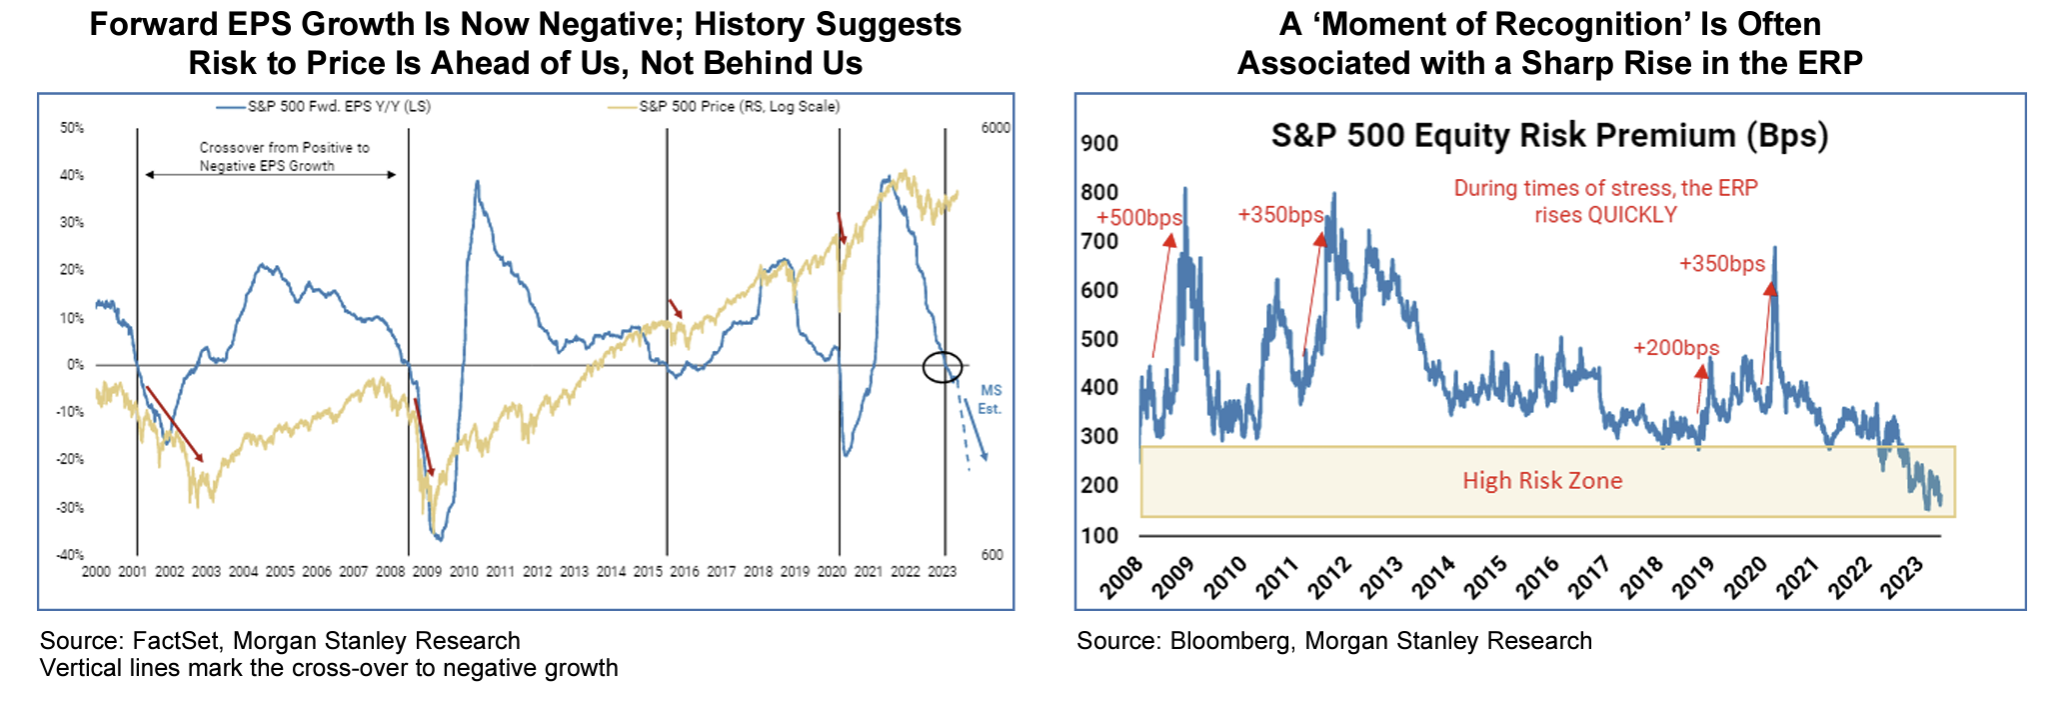 Data as of 06.05.2023
John Luke: fortunately, excessive valuations are mostly tied up in the tech sector, with the rest of the market historically reasonable
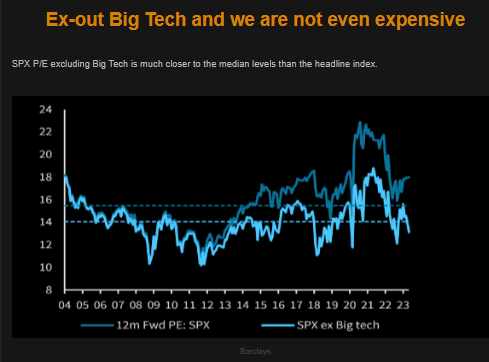 Source: Barclays as of 06.07.2023
Dave: with a contrast even from large cap tech vs. small cap tech
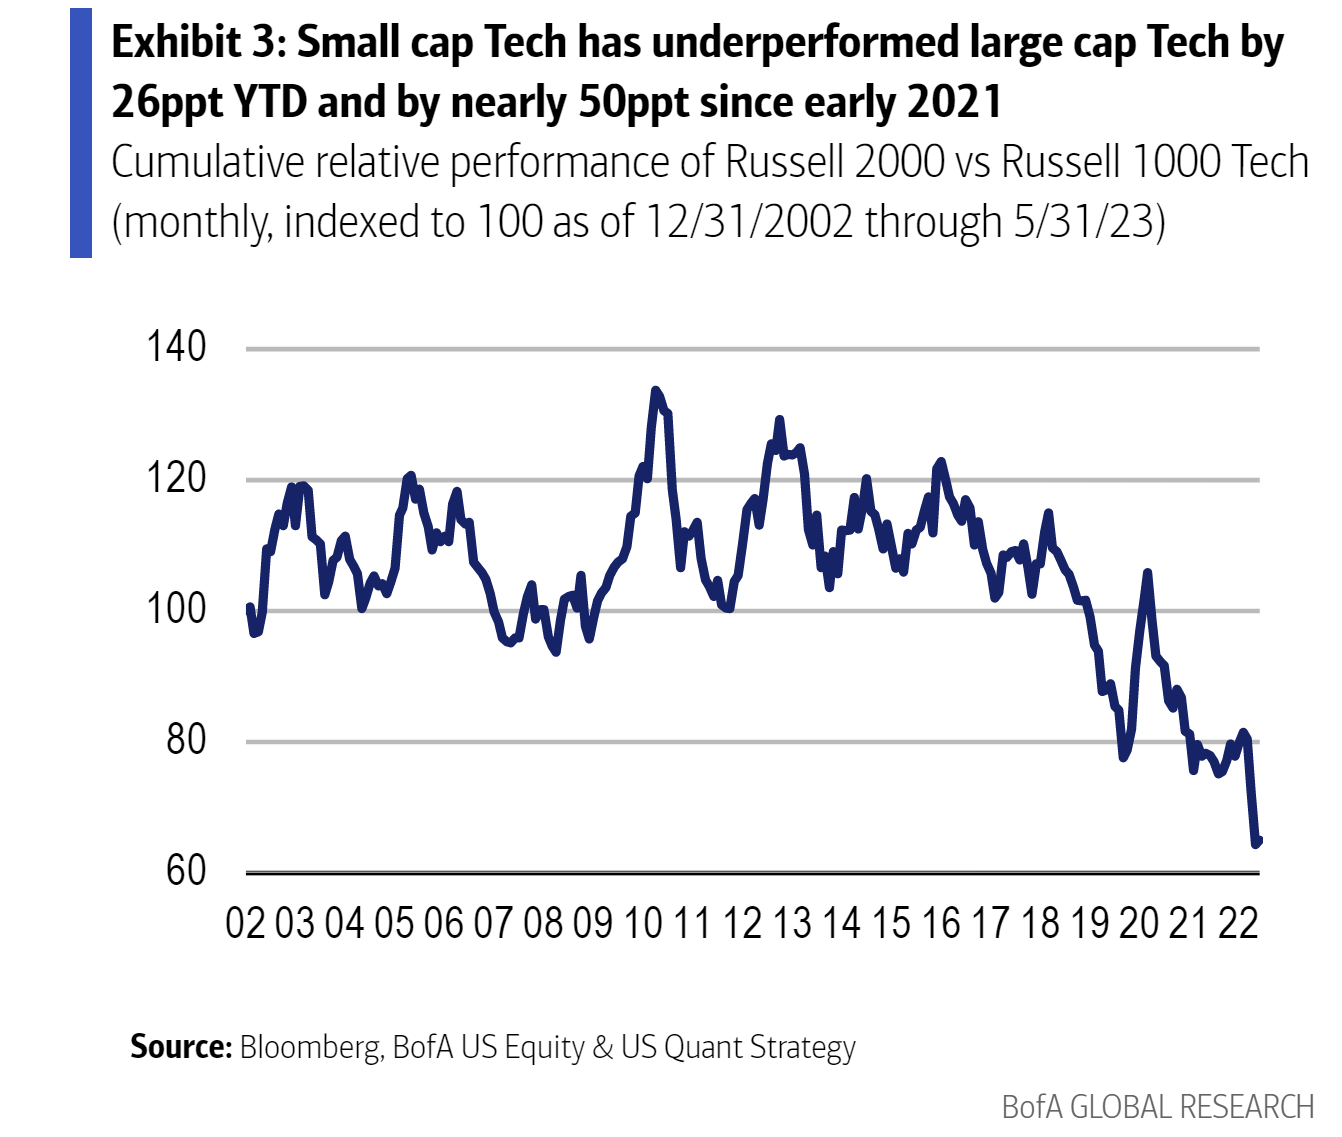 Source: BofA as of 06.02.2023
John Luke: It’s our job to continue taking note of the economic warnings being signaled by the yield curve
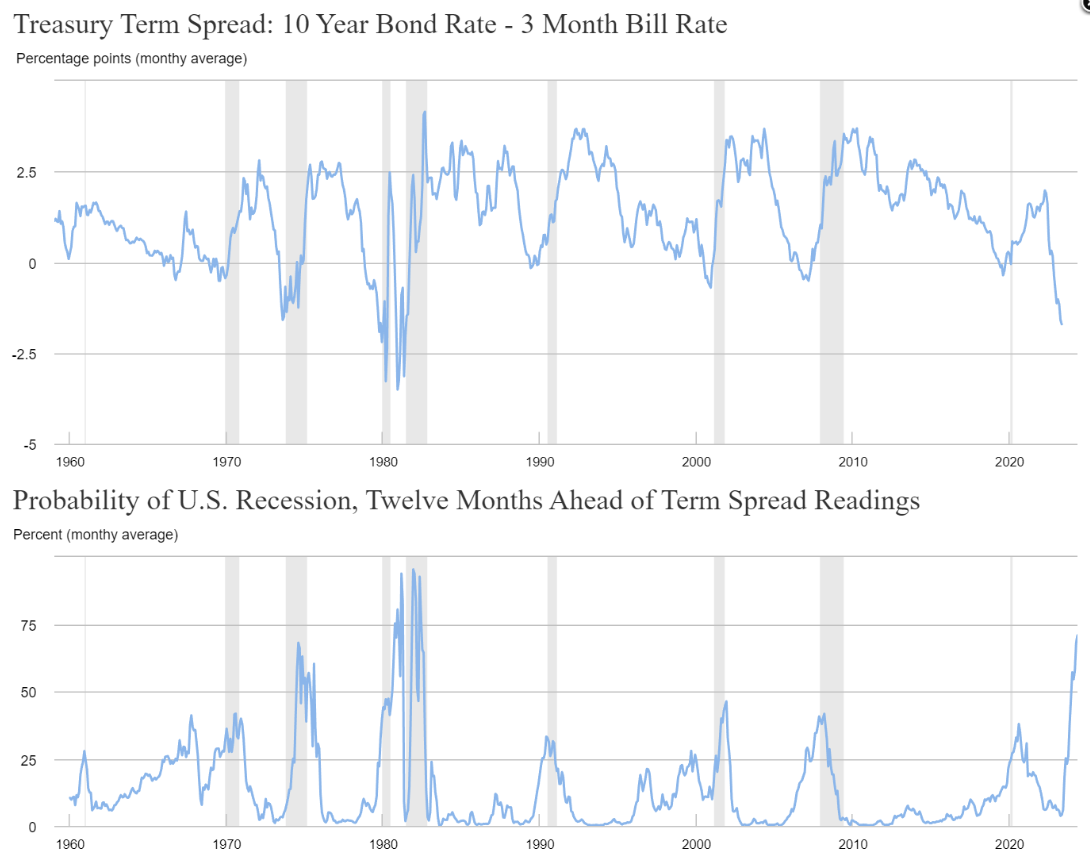 Source: Federal Reserve Bank of NY as of 06.05.2023
John Luke: but also note that markets are moving away from their rate cut expectations and towards the Fed’s view
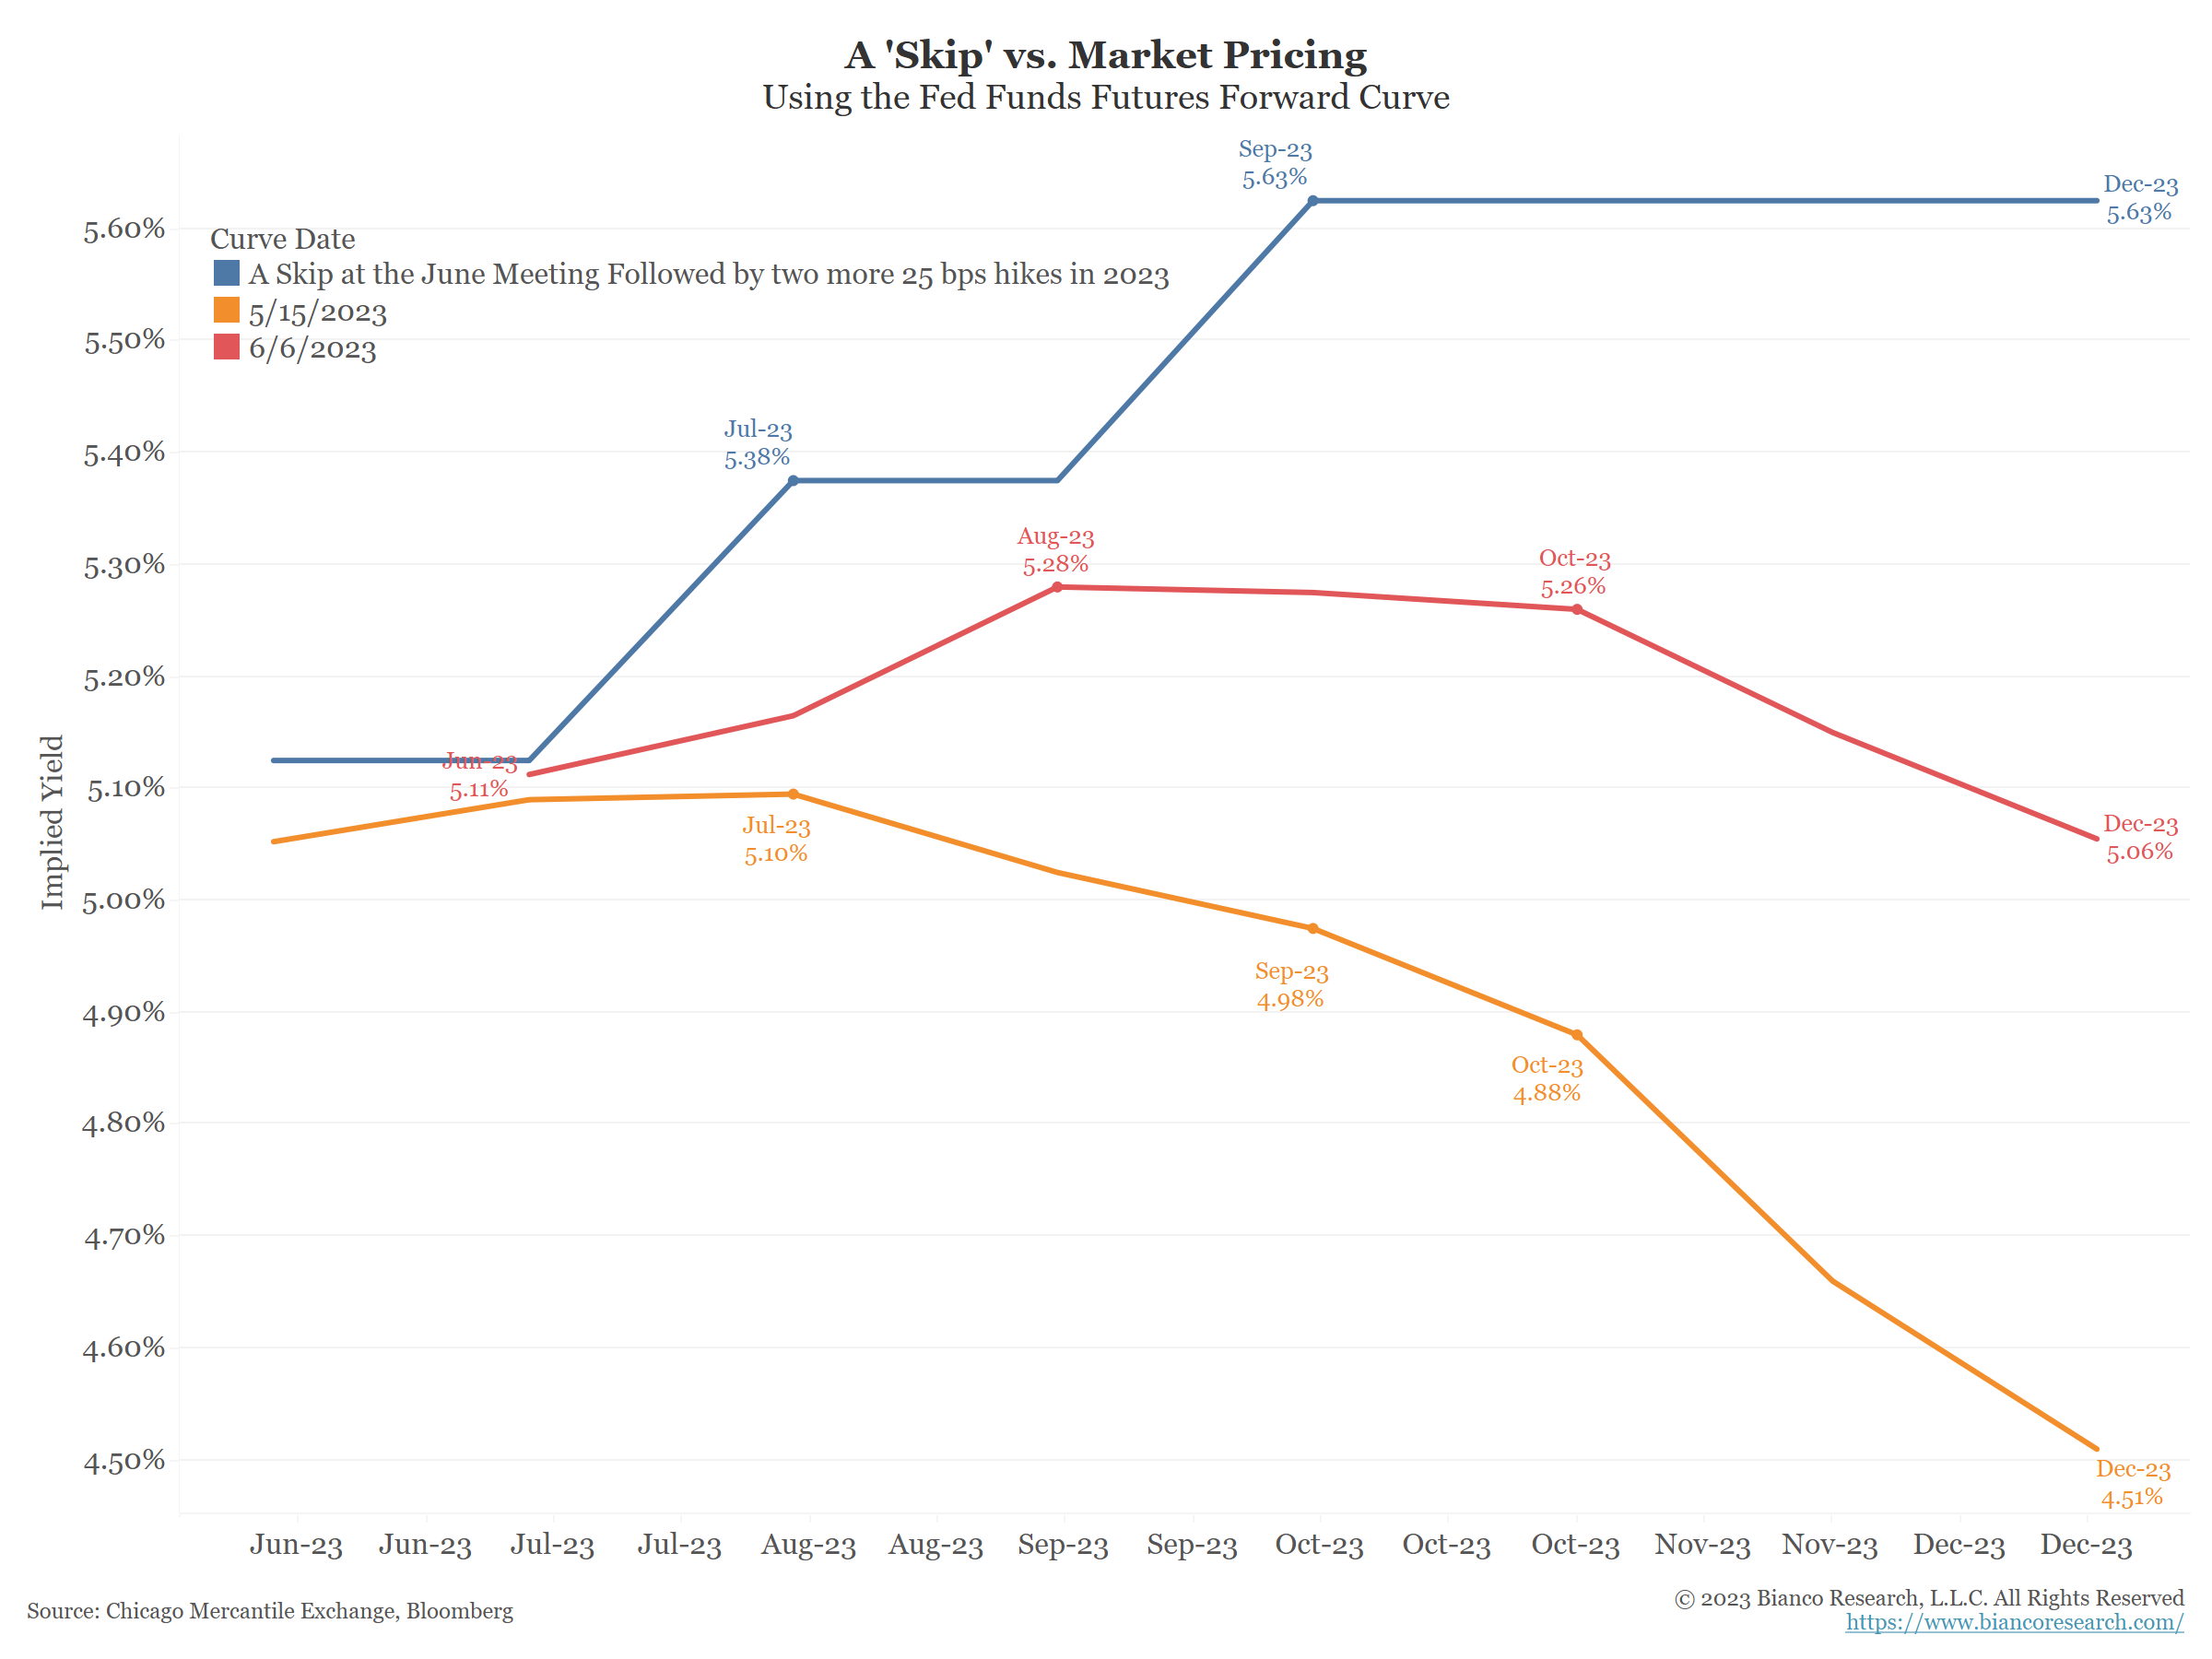 Source: Bianco as of 06.06.2023
Dave: 20% is an arbitrary marker but If this bear market is truly over, it falls about in the middle of average length and drawdown
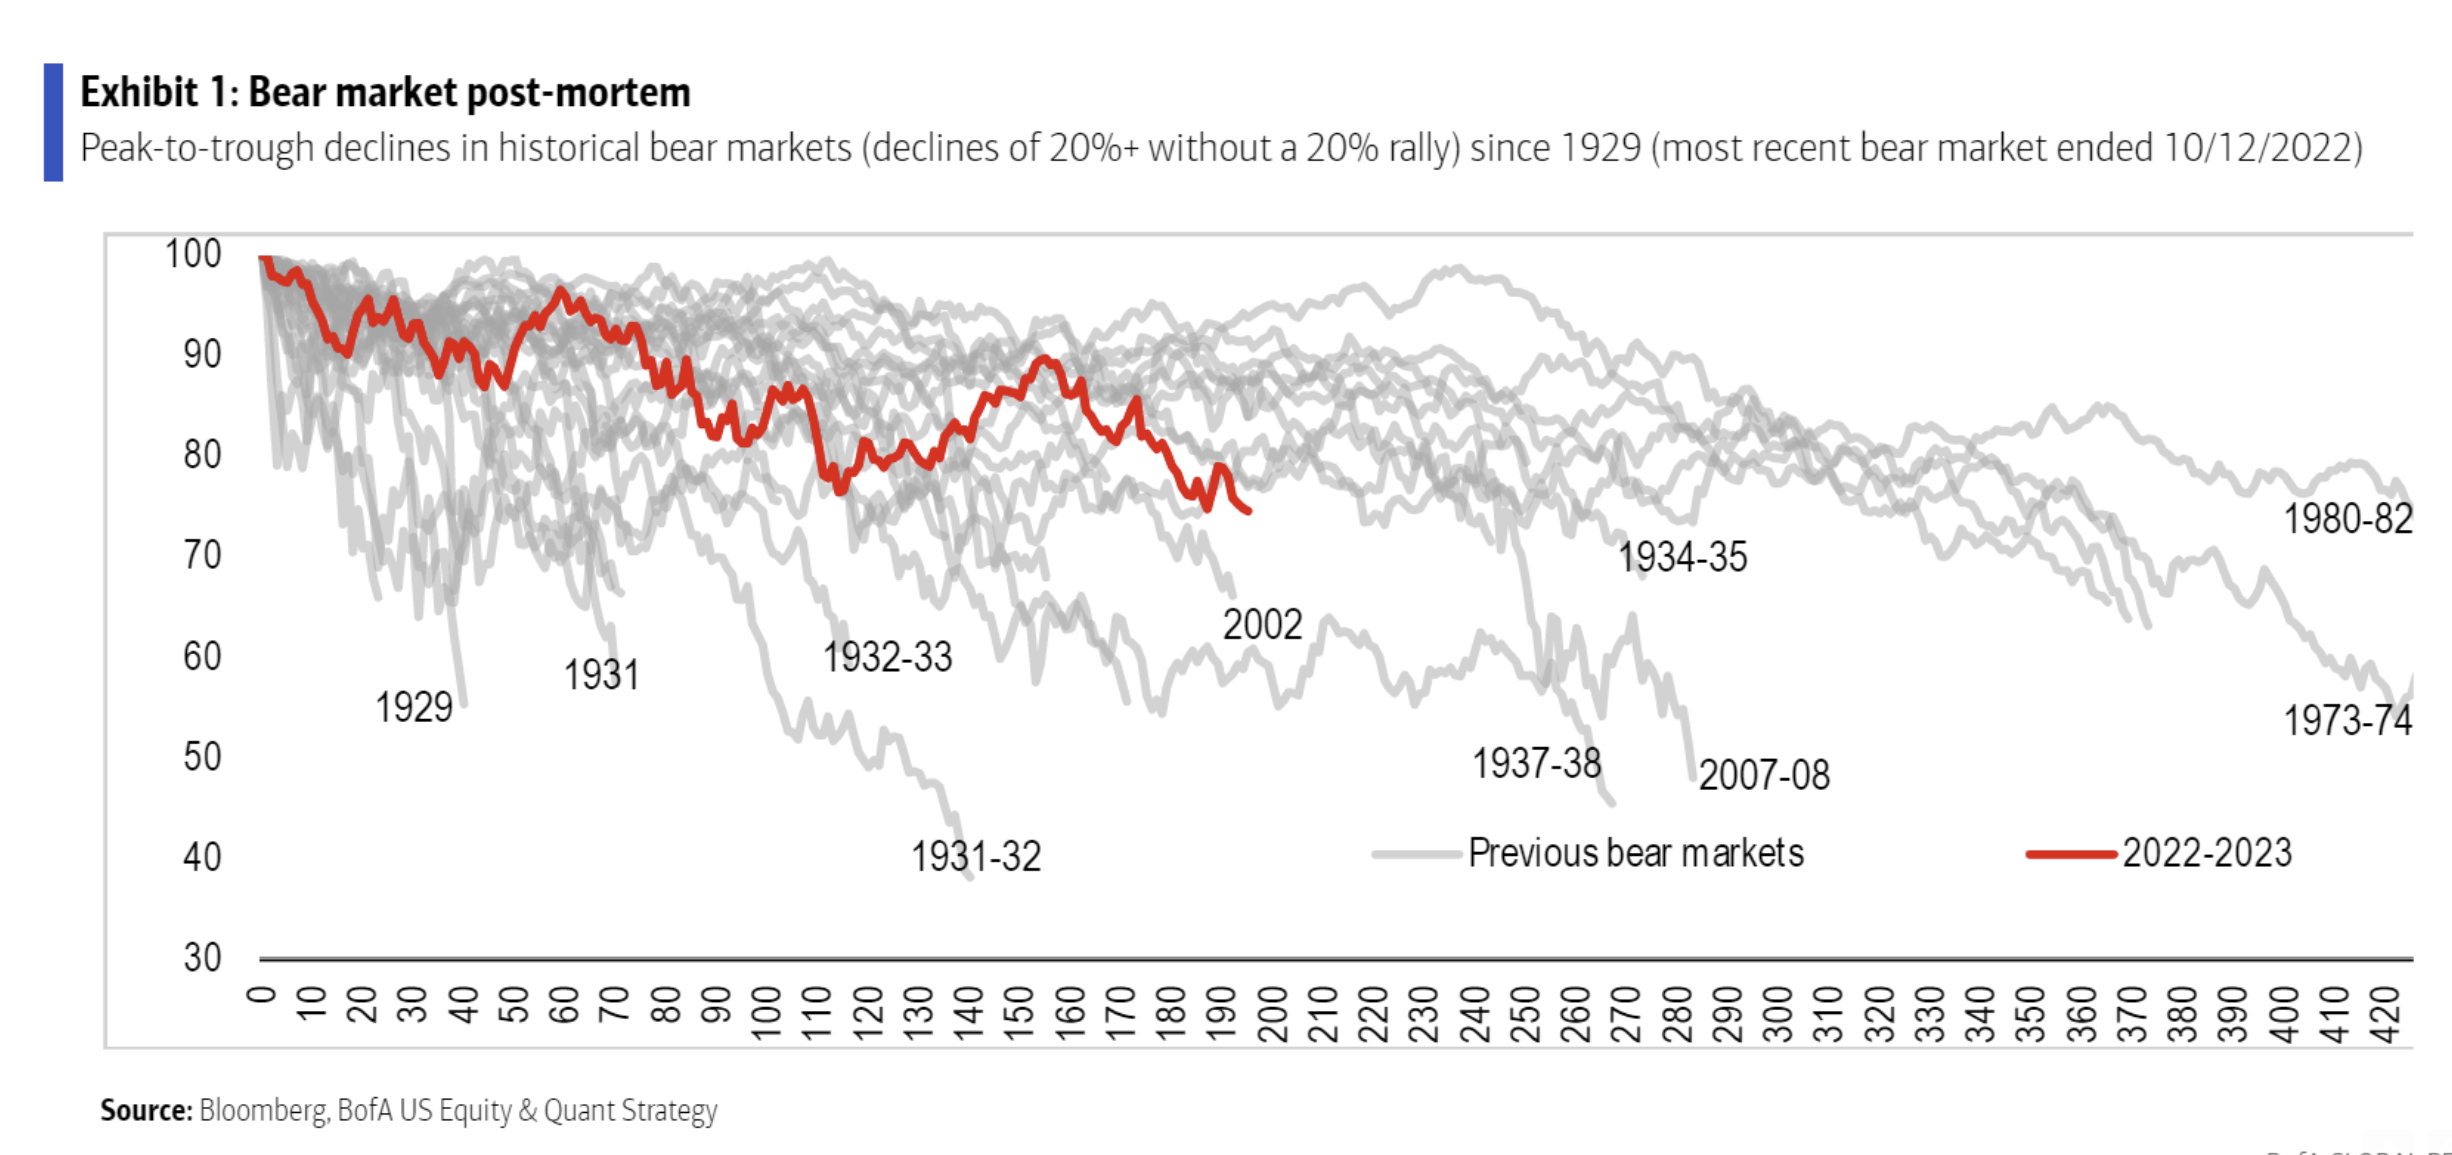 Data as of 06.08.2023
Disclosures
Past performance is not indicative of future results. This material is not financial advice or an offer to sell any product. The information contained herein should not be considered a recommendation to purchase or sell any particular security. Forward-looking statements cannot be guaranteed.
Projections or other forward-looking statements regarding future financial performance of markets are only predictions and actual events or results may differ materially.
This commentary offers generalized research, not personalized investment advice. It is for informational purposes only and does not constitute a complete description of our investment services or performance. Nothing in this commentary should be interpreted to state or imply that past results are an indication of future investment returns. All investments involve risk and unless otherwise stated, are not guaranteed. Be sure to consult with an investment & tax professional before implementing any investment strategy. Investing involves risk. Principal loss is possible.
Advisory services are offered through Aptus Capital Advisors, LLC, a Registered Investment Adviser registered with the Securities and Exchange Commission. Registration does not imply a certain level or skill or training. More information about the advisor, its investment strategies and objectives, is included in the firm’s Form ADV Part 2, which can be obtained, at no charge, by calling (251) 517-7198. Aptus Capital Advisors, LLC is headquartered in Fairhope, Alabama. ACA-2306-10.
