Our team looks at a lot of research throughout the day. Here are a handful of charts we think are good summations of investor activity, from rate expectations to inflation, jobs to earnings, and of course, the unprecedented artificial intelligence spend. Have a great weekend!
John: Market hopes for rate cuts in the Warsh-led Fed have disappeared
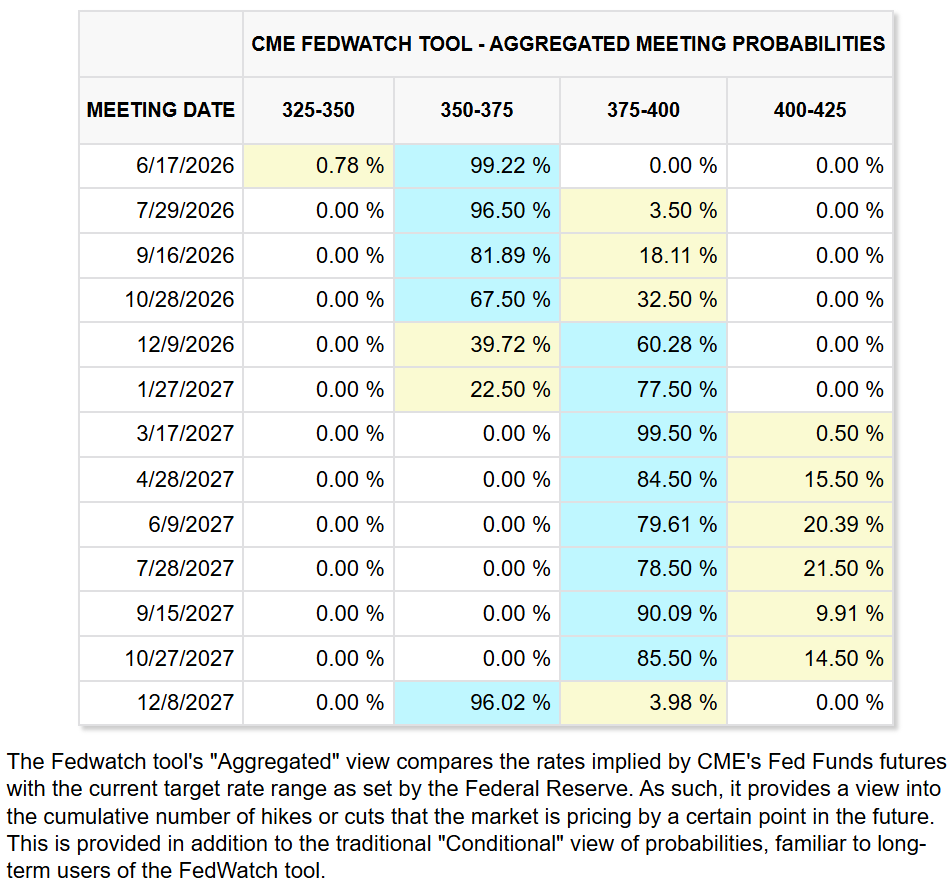
Source: CME as of 05.15.2026
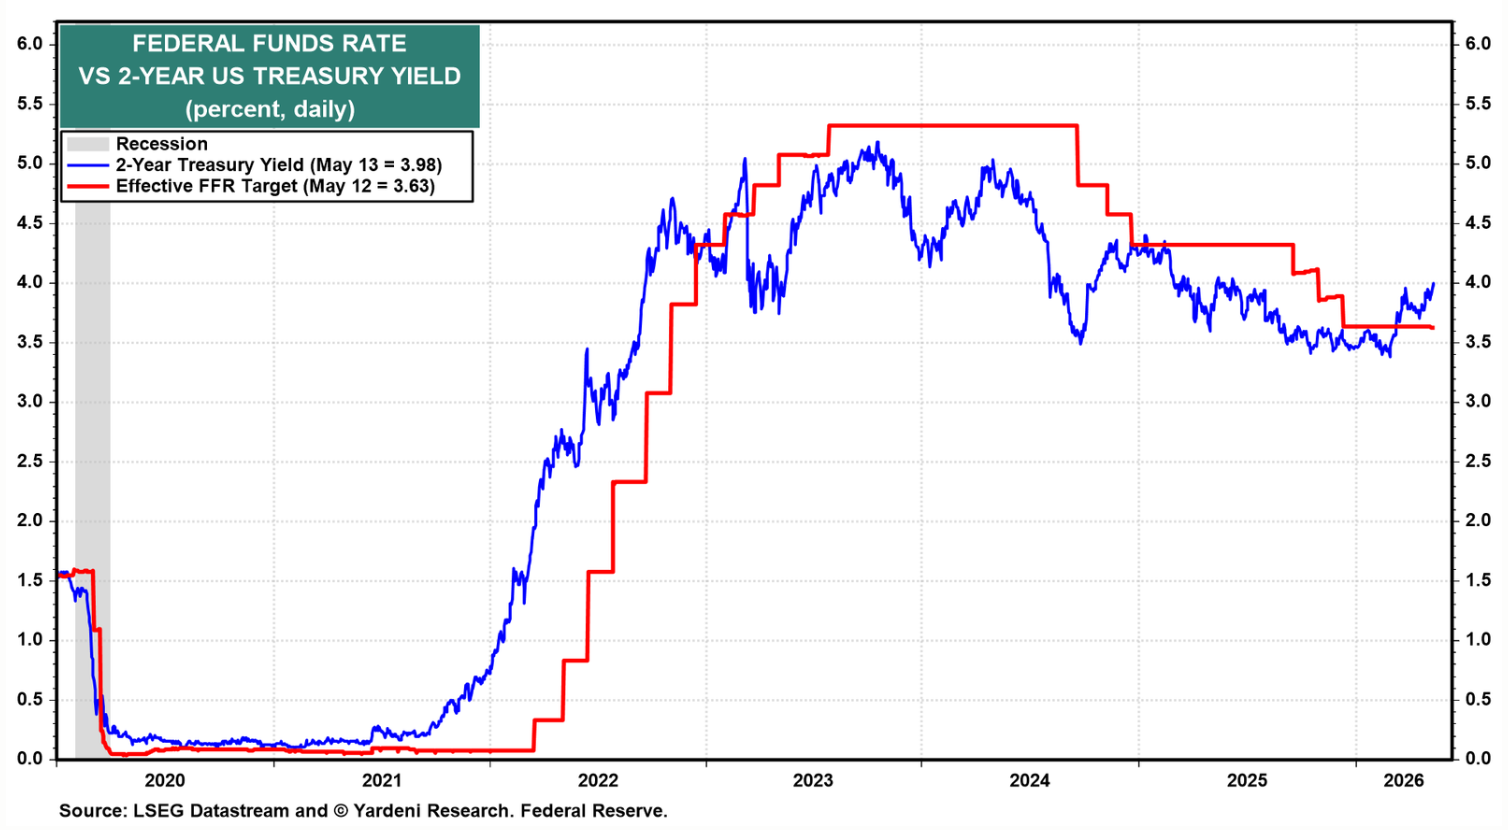
Brian: as usual, markets are out in front of the newly published expectations
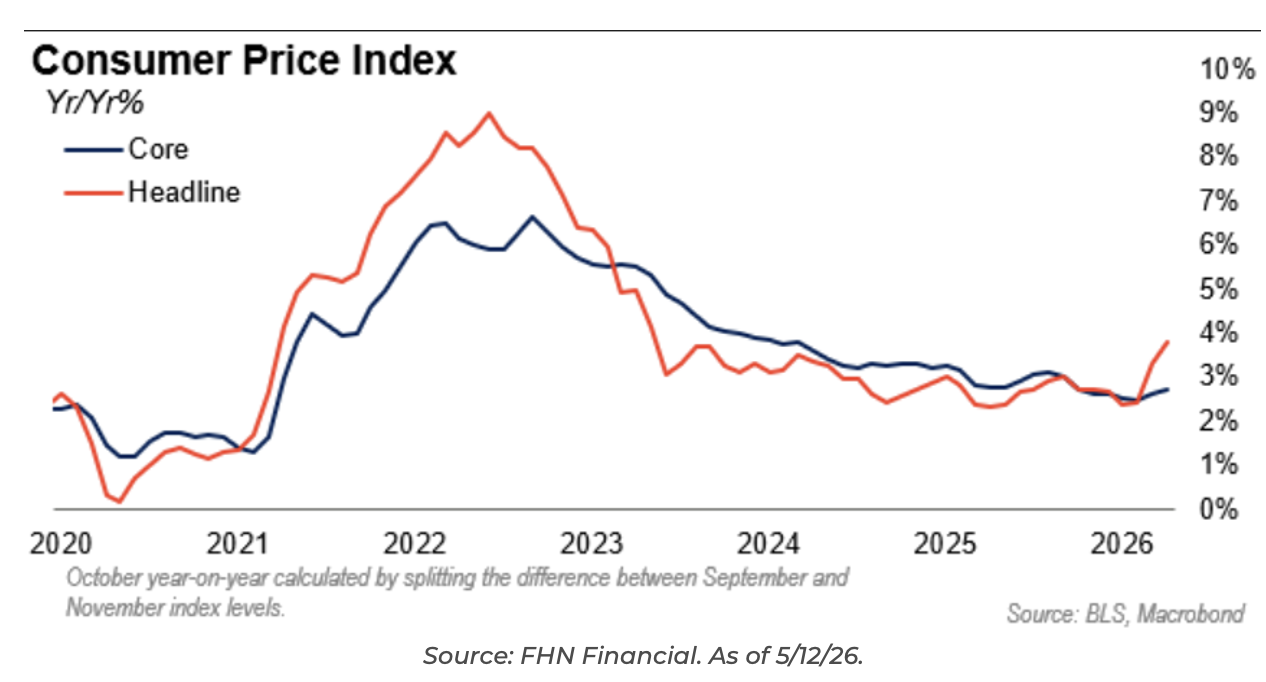
Beckham: Staying in the sweet spot of 2-4% inflation has been good for stocks, repeating most historic episodes

Source: Bespoke as of 05.12.2026
Dave: and for now, core price changes remain more stable than the energy-driven headline numbers
Jake: though global bond vigilantes are pushing back
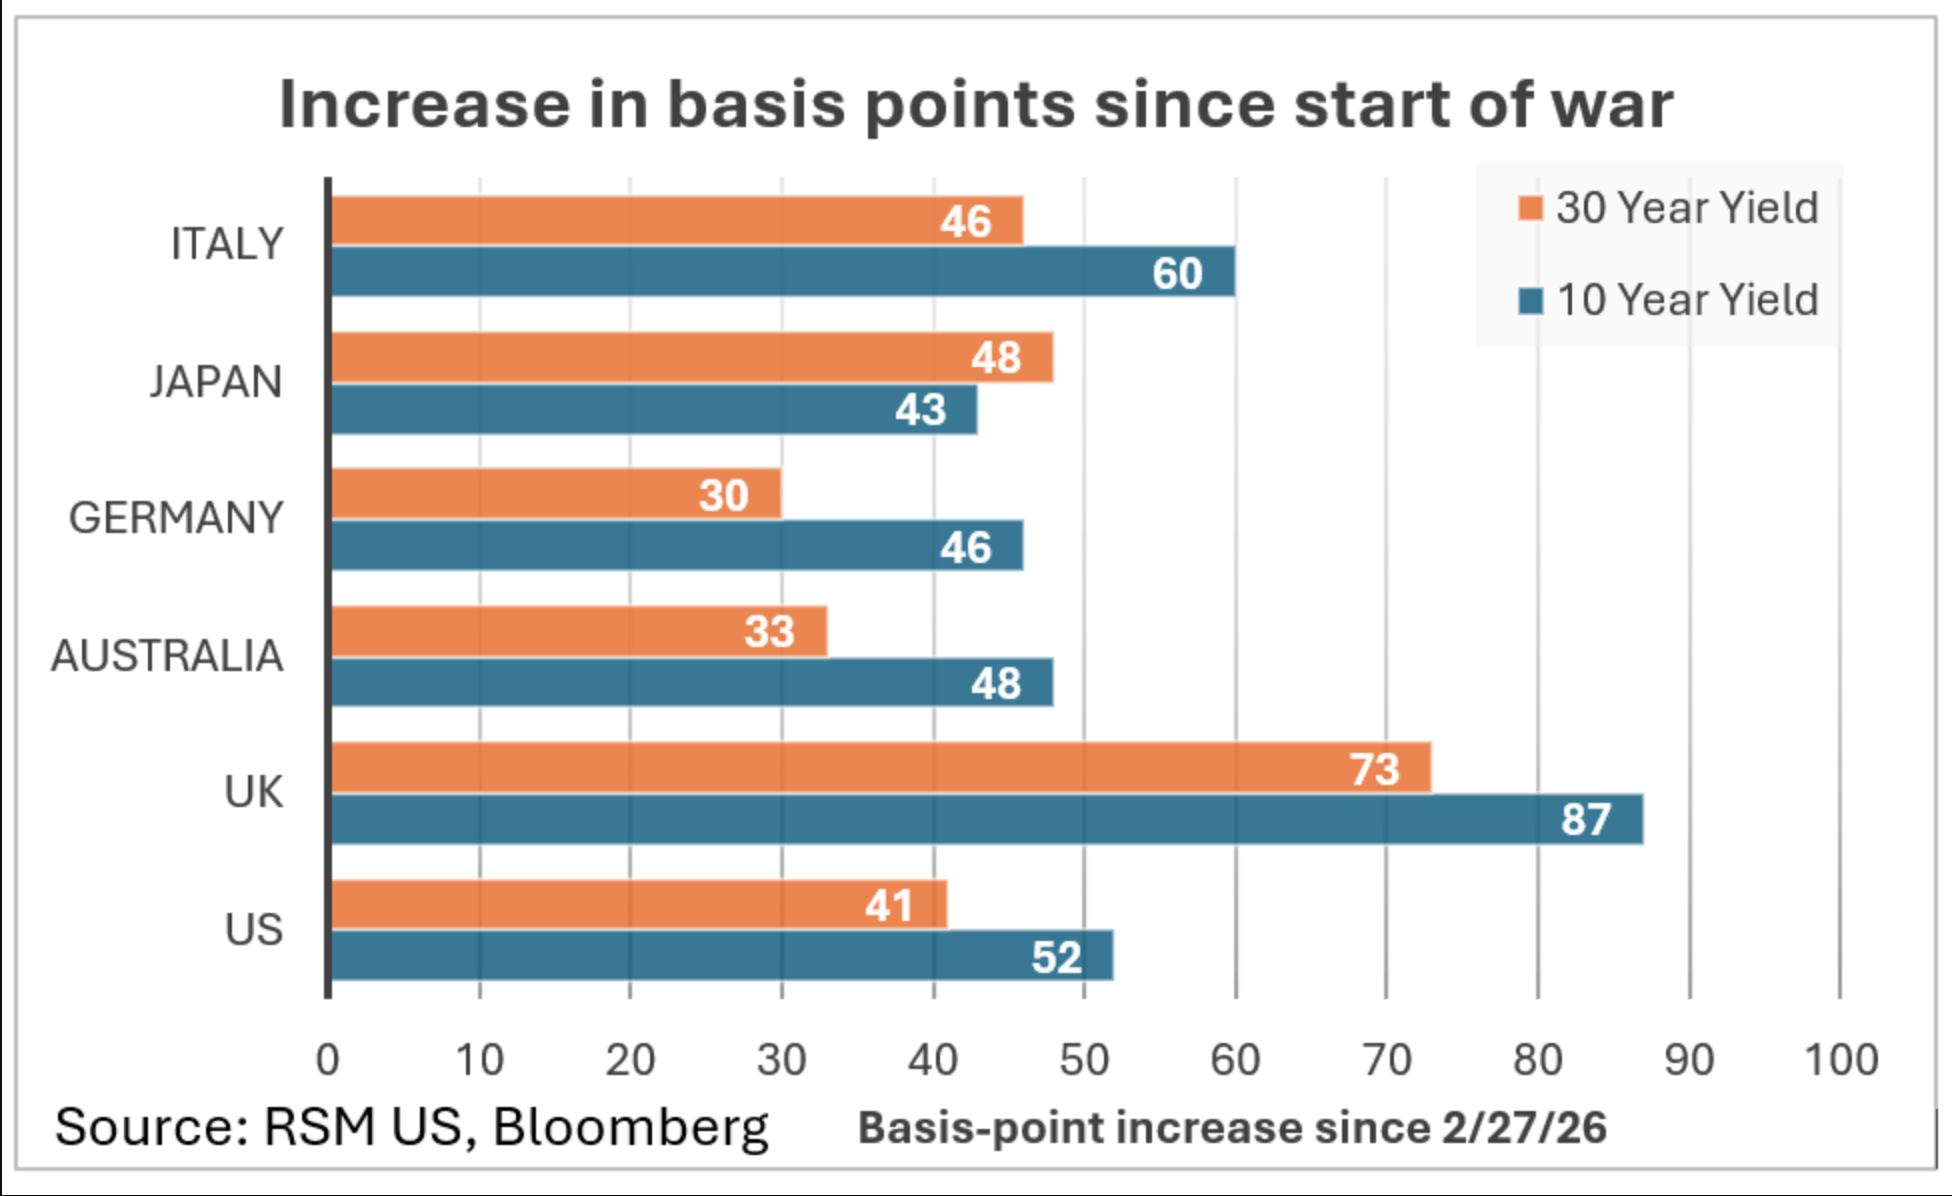 Data as of 05.13.2026
Ten: Consumers seem to be getting more comfortable with their ability to pay bills
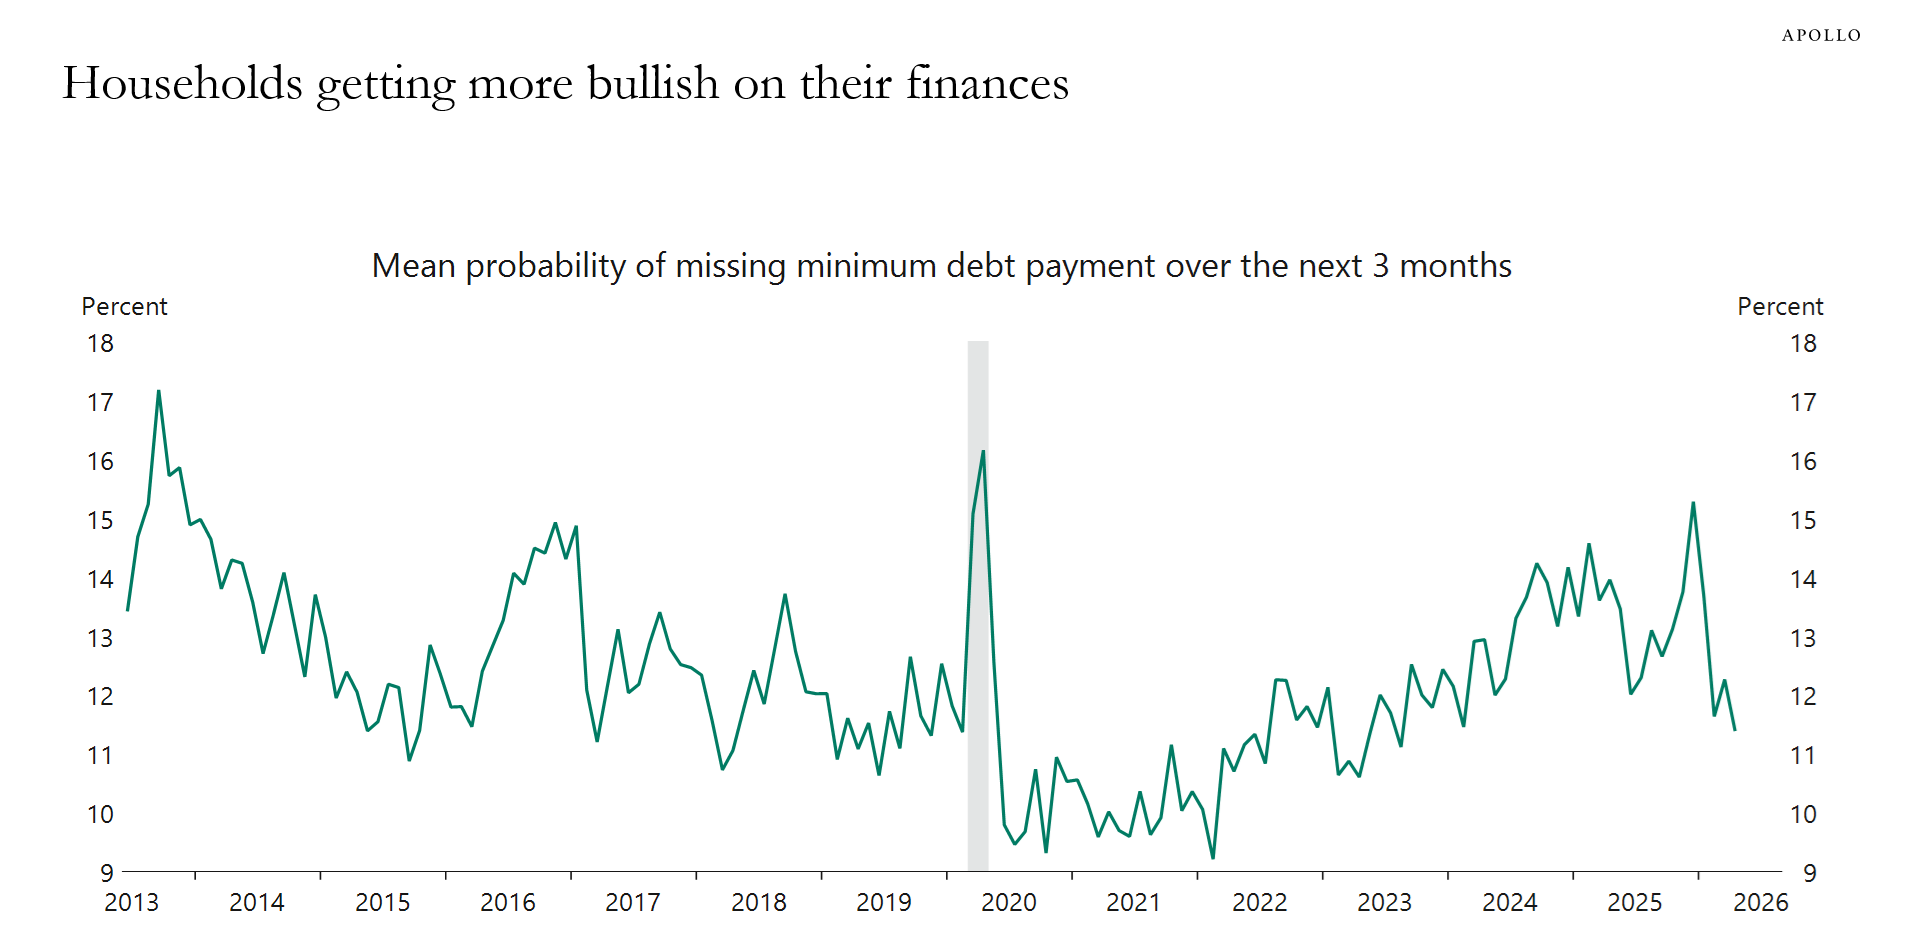 Source: Apollo as of 05.14.2026
Brad: and we’re seeing a resumption in employment demand
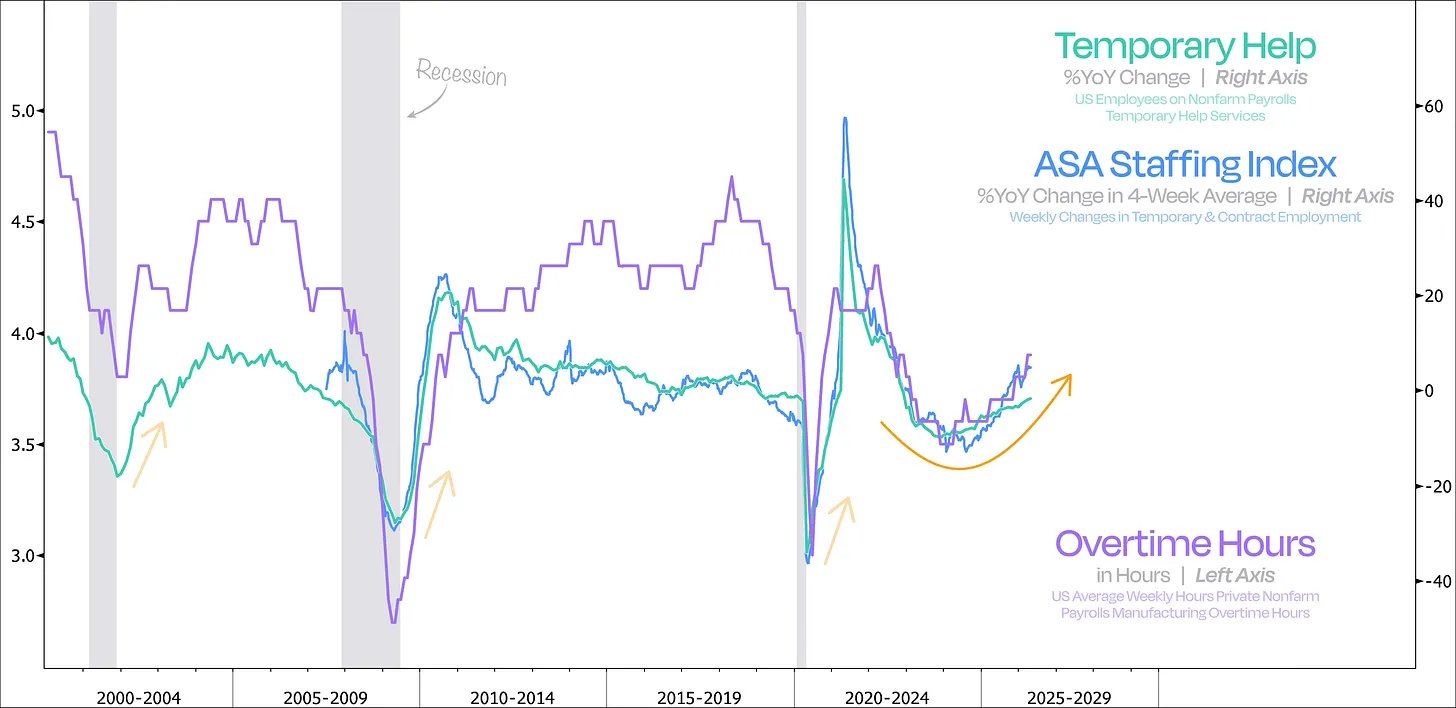 Source: Duality Research as of 05.12.2026
Mark: this, despite the continued ability of technology companies to grow without adding headcount
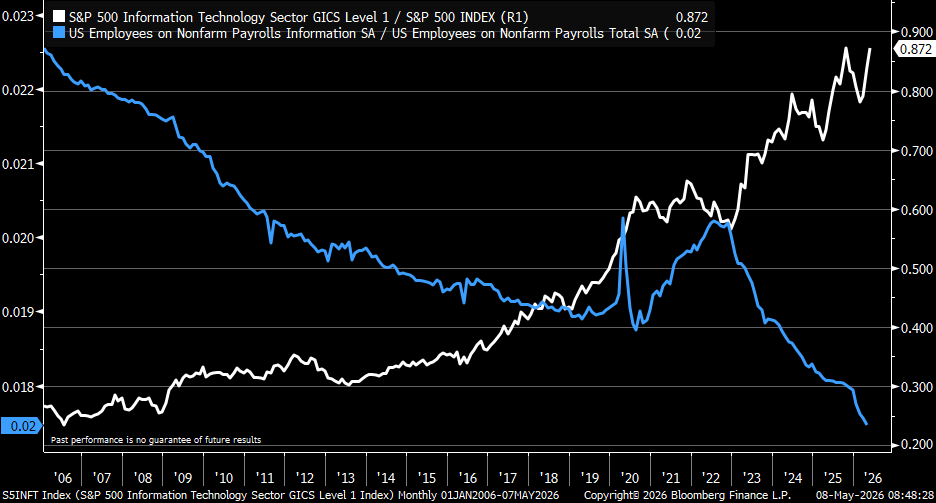 Graphic via @KevRGordon as of 05.09.2026
Brad: The equity rally hasn’t lifted valuations one bit, as earnings have matched the entire rise
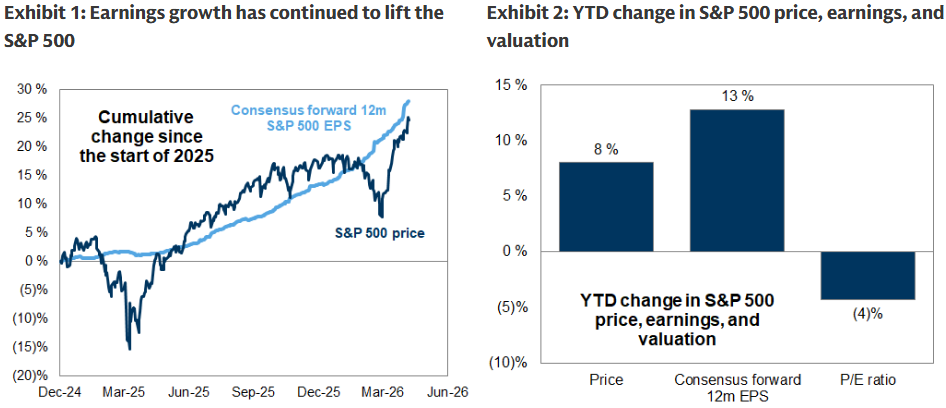 Source: Goldman Sachs as of 05.11.2026
Dave: and the earnings forecasts continue to be a significant tailwind
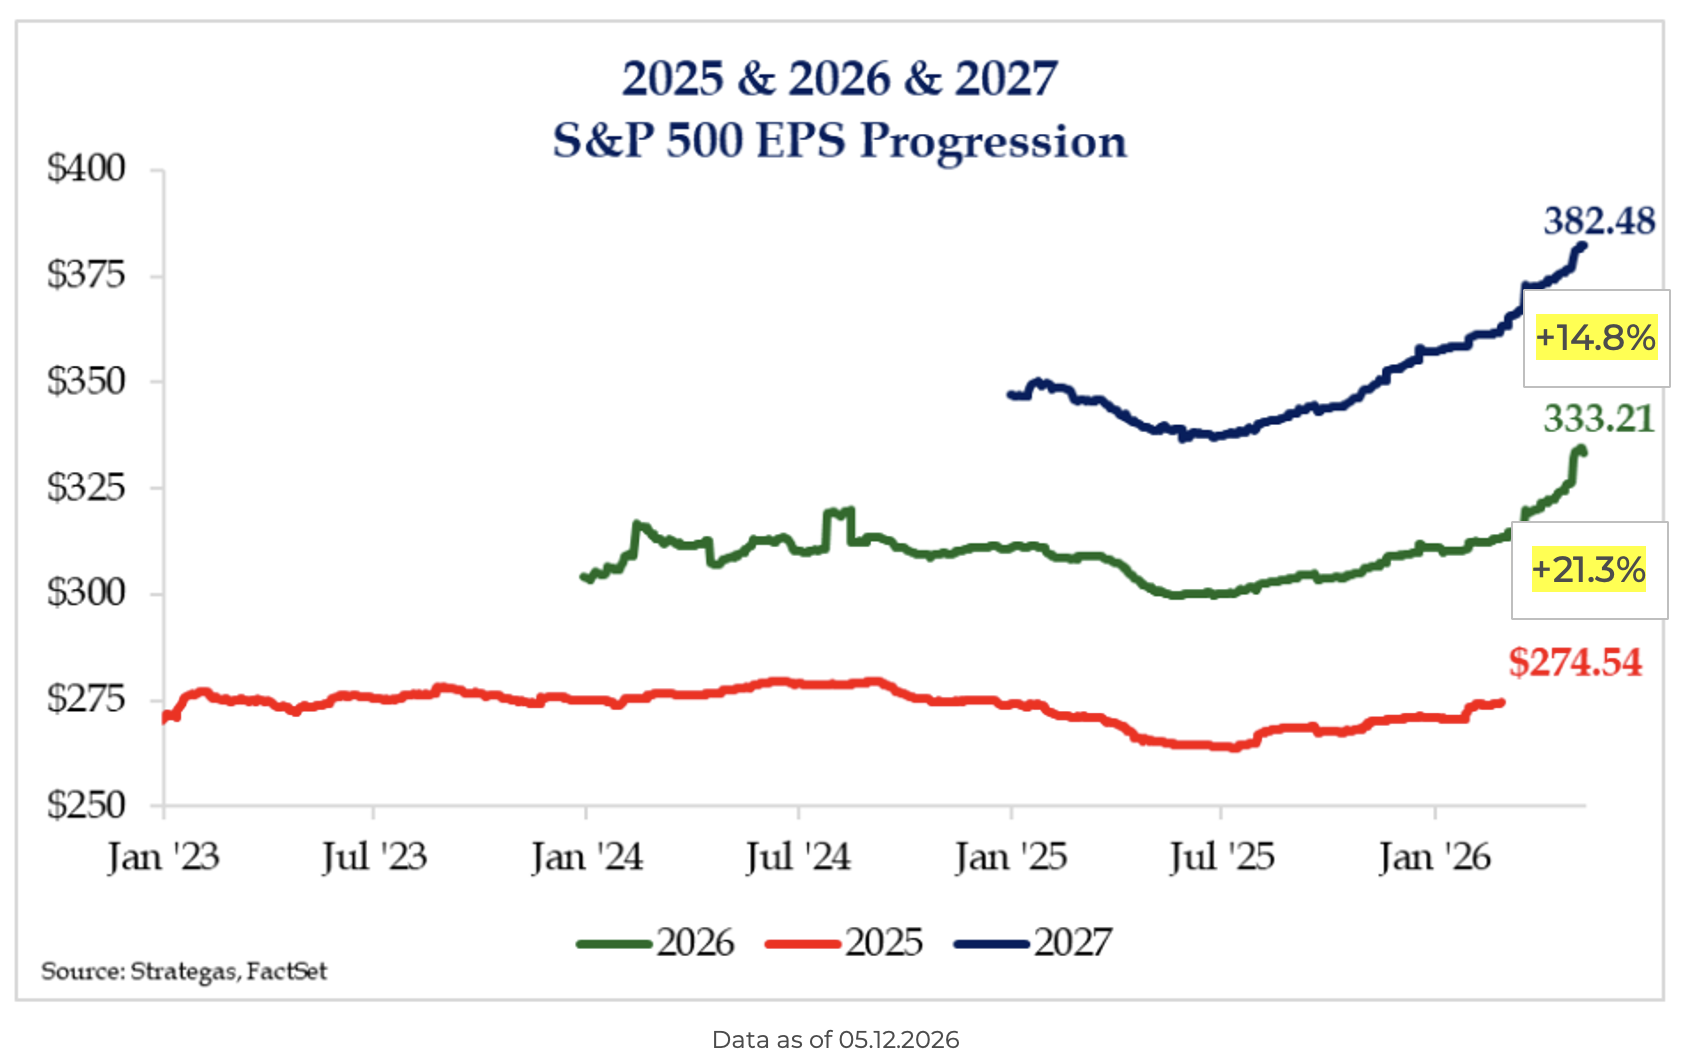
Dave: with an especially sharp (and unique) lift in expectations throughout the early part of the year
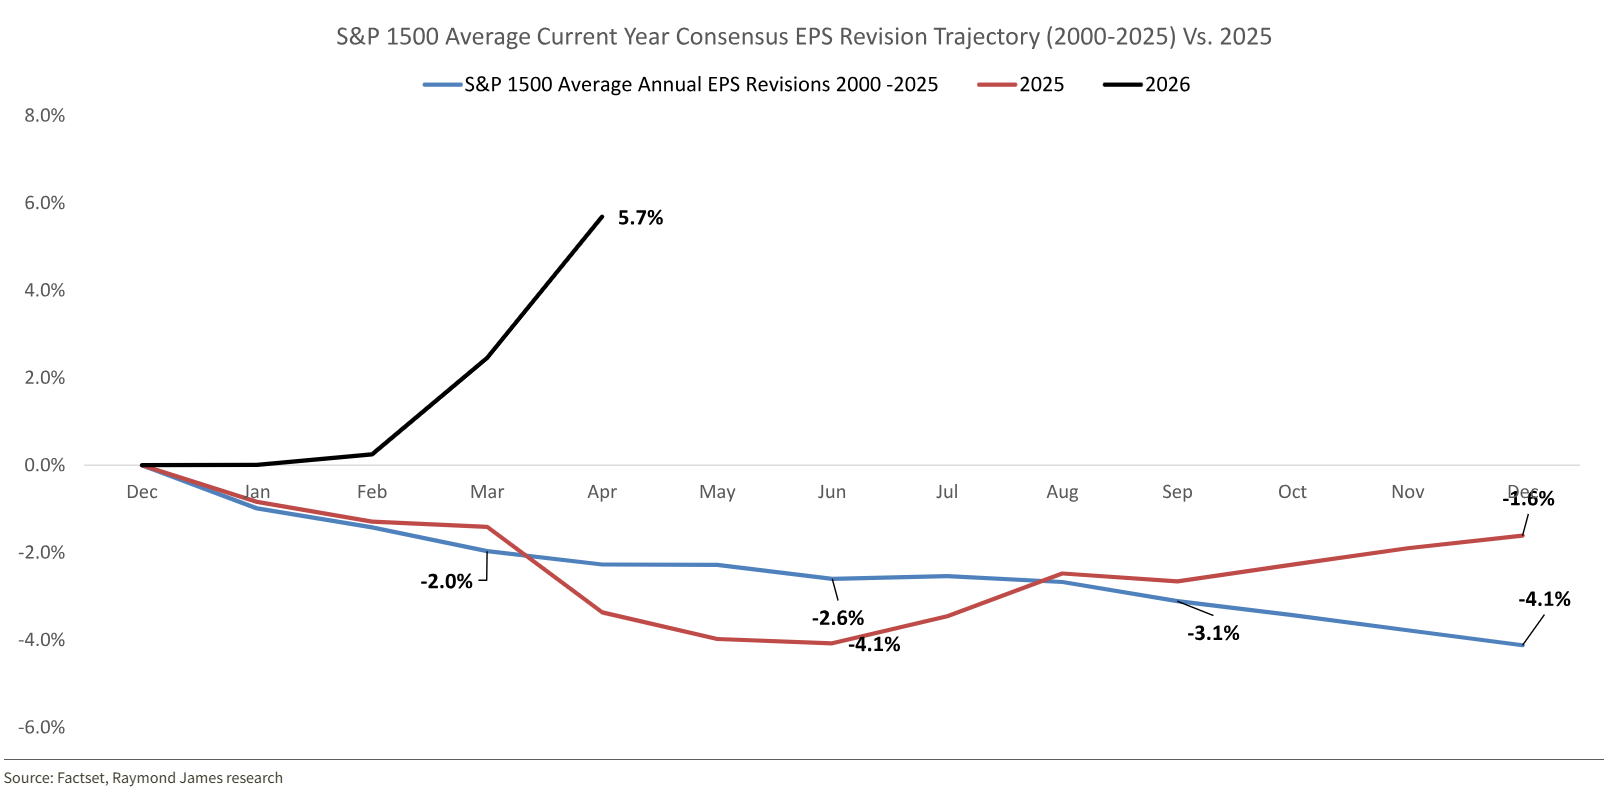 Data as of 05.12.2026
Joseph: and even small caps participating in steady earnings growth after a period of weakness
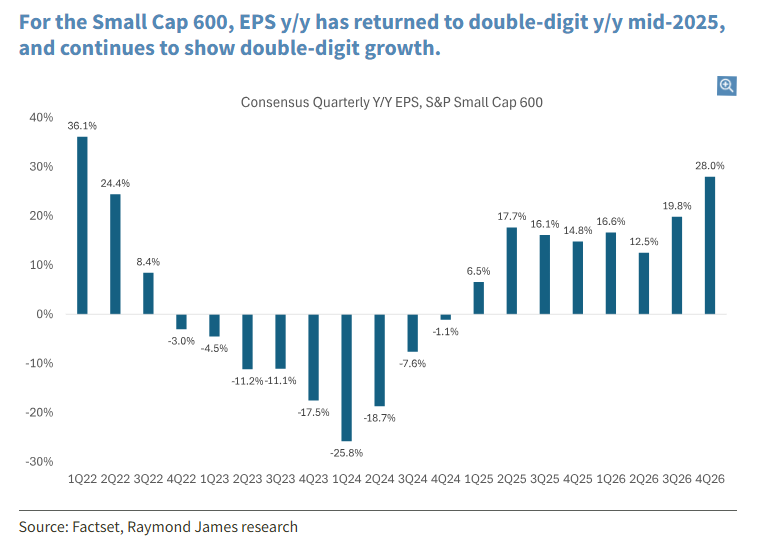 Data as of 05.12.2026
Dave: The largest tech companies are putting every dollar they can find into AI spending
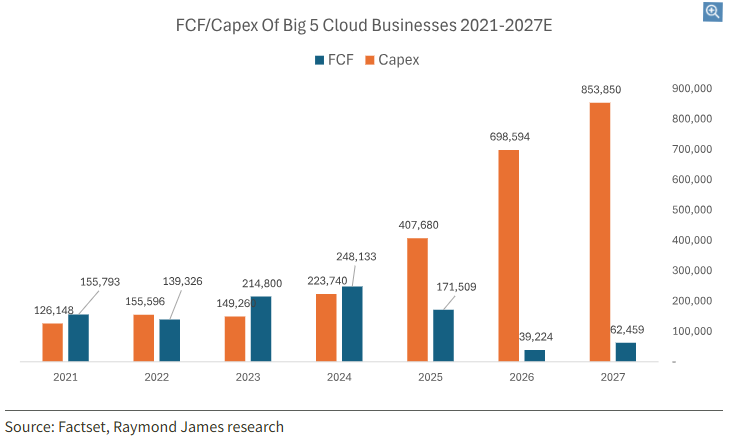 Data as of 05.11.2026
John Luke: and given the historic pace of innovation, it’s hard to blame them for wanting to keep up
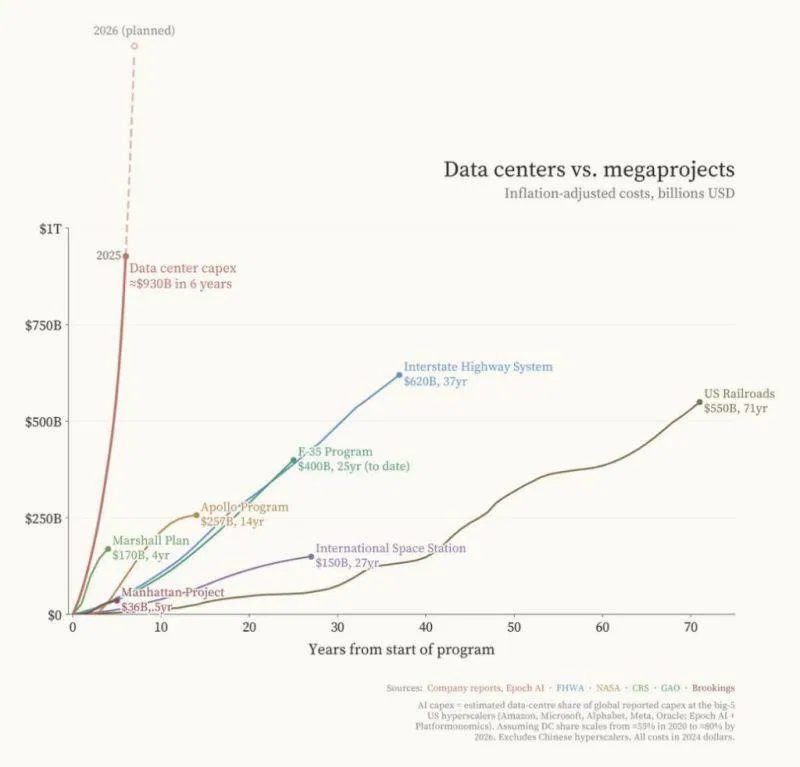 Data as of March 2025
Beckham: Earnings continue to be the primary driver of price appreciation
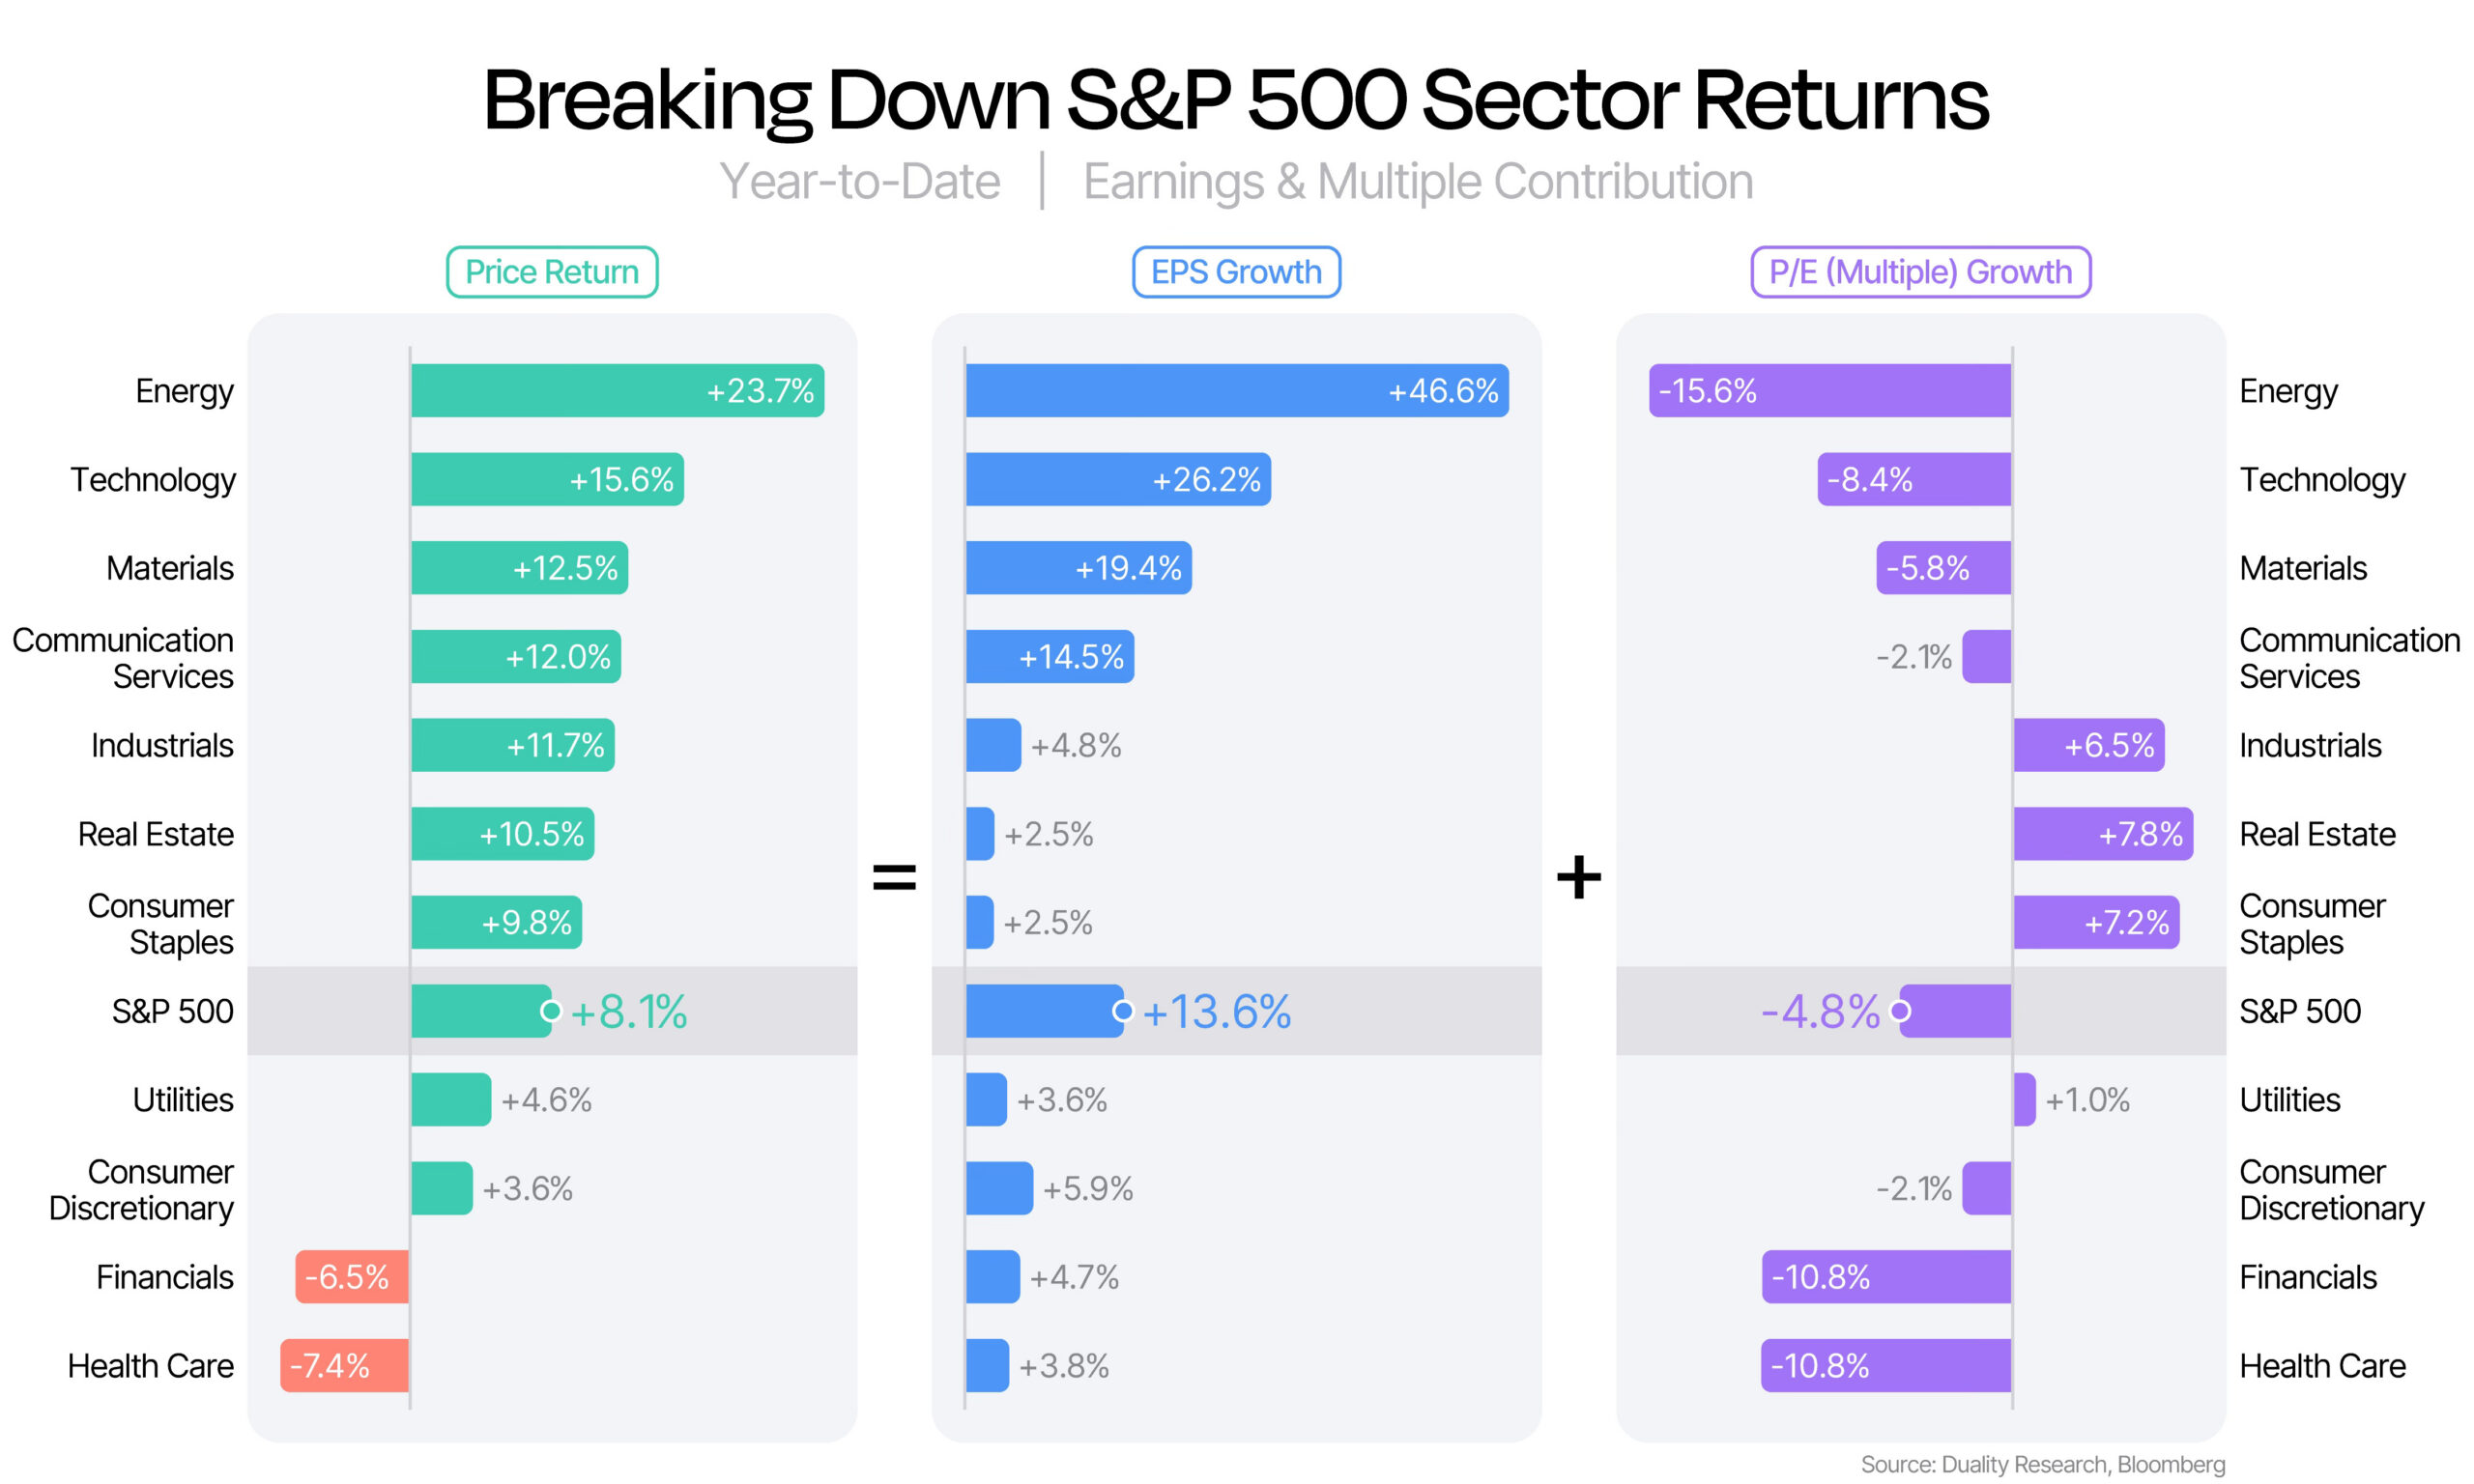 Data as of 05.08.2026
JD: and the S&P 500 continues to be a tough benchmark to beat
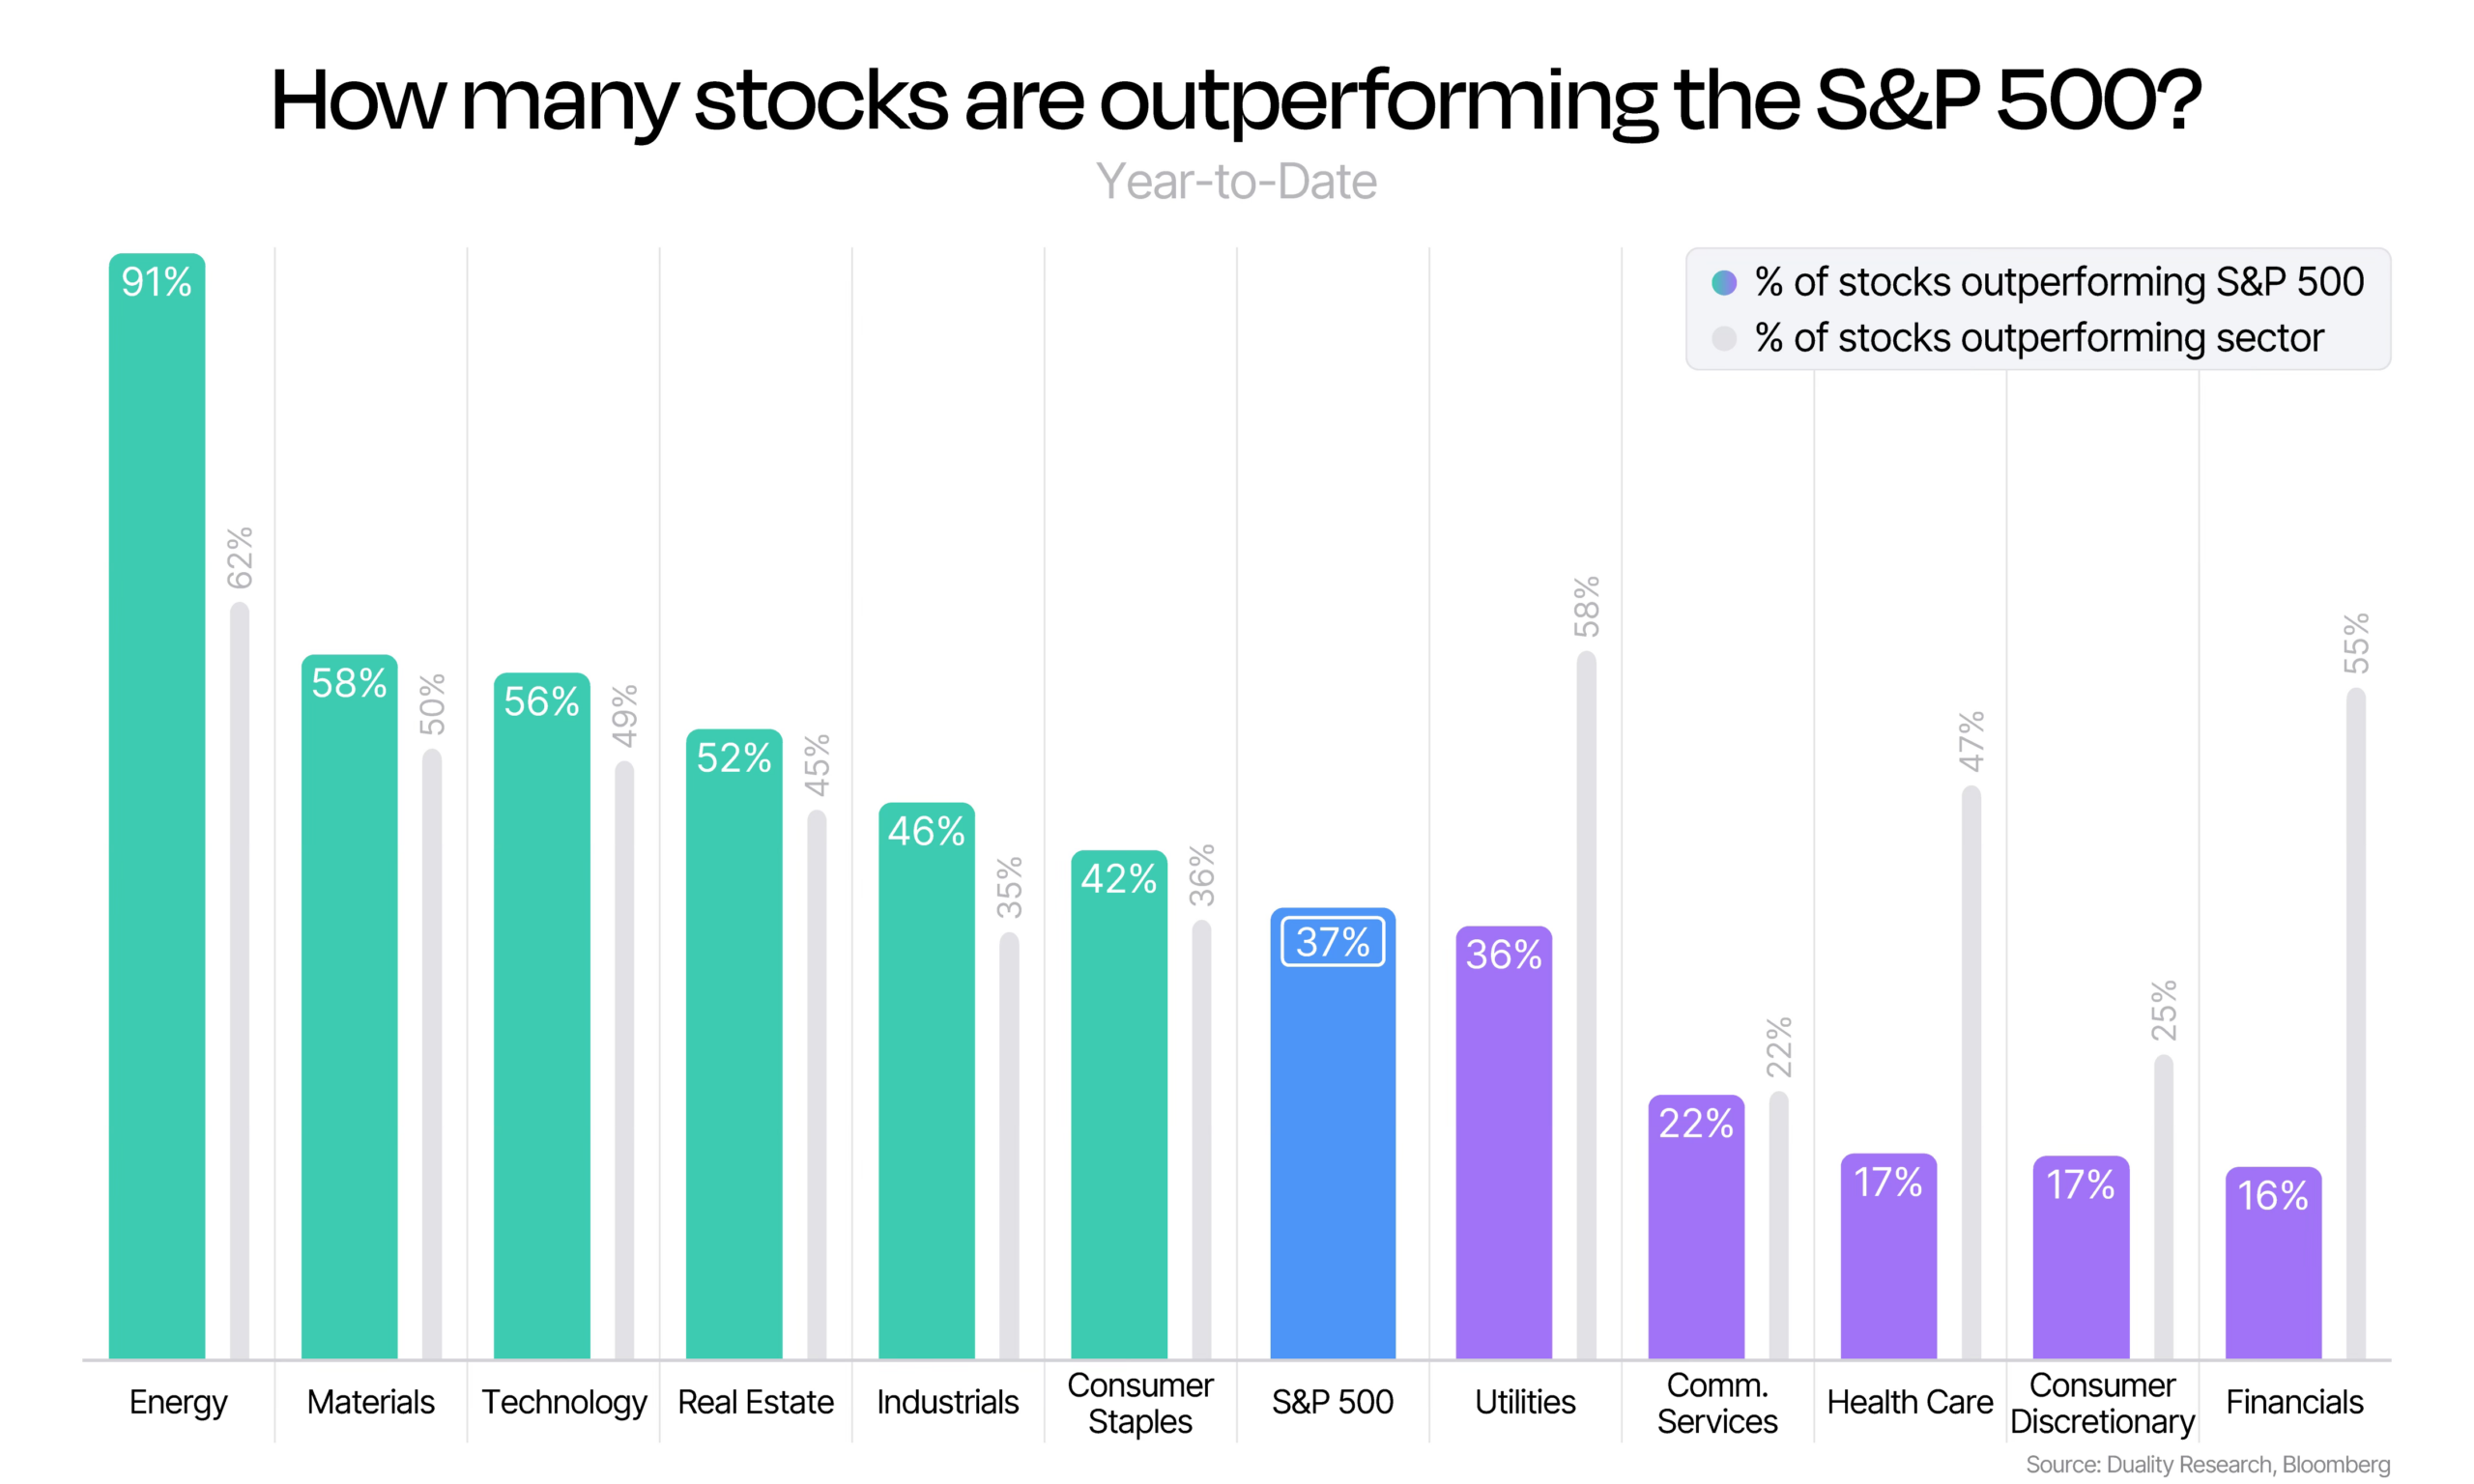 Data as of 05.08.2026
Brad: Would-be market-timers often forget the wide range of goals and timeframes across various constituents
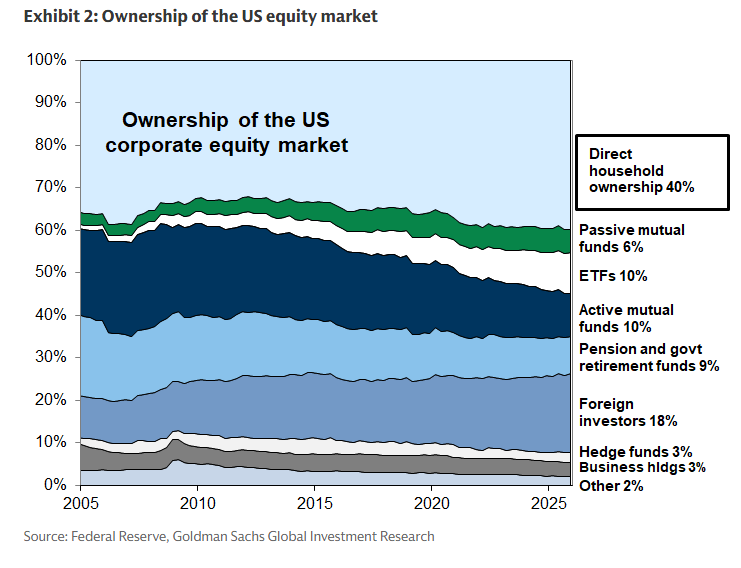 Data as of April 2026
Disclosures
Past performance is not indicative of future results. This material is not financial advice or an offer to sell any product. The information contained herein should not be considered a recommendation to purchase or sell any particular security. Forward-looking statements cannot be guaranteed.
Projections or other forward-looking statements regarding future financial performance of markets are only predictions and actual events or results may differ materially.
This commentary offers generalized research, not personalized investment advice. It is for informational purposes only and does not constitute a complete description of our investment services or performance. Nothing in this commentary should be interpreted to state or imply that past results are an indication of future investment returns. All investments involve risk and unless otherwise stated, are not guaranteed. Be sure to consult with an investment & tax professional before implementing any investment strategy. Investing involves risk. Principal loss is possible.
Advisory services are offered through Aptus Capital Advisors, LLC, a Registered Investment Adviser registered with the Securities and Exchange Commission. Registration does not imply a certain level of skill or training. More information about the advisor, its investment strategies and objectives, is included in the firm’s Form ADV Part 2, which can be obtained, at no charge, by calling (251) 517-7198. Aptus Capital Advisors, LLC is headquartered in Fairhope, Alabama. ACA-2605-15.
