Our team looks at a lot of research throughout each day. A few charts that caught our eye this week, and the way they fit the unfolding puzzle of evidence:
JL: Year-over-year food costs are set to deflate for the first time since pre-COVID
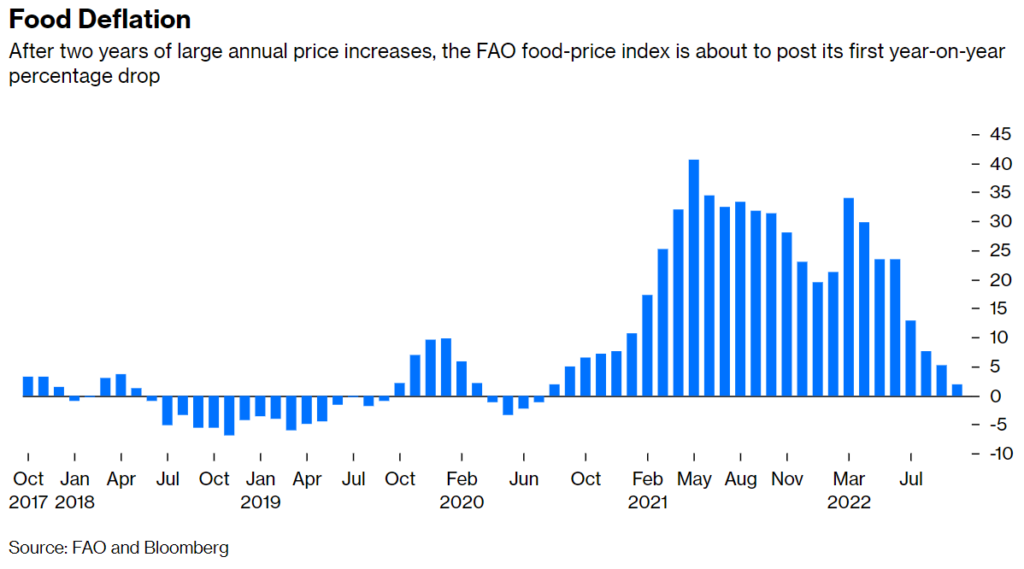
Source: Bianco as of 11.16.2022
Brad: though food costs are an outlier when you look across the universe of CPI components
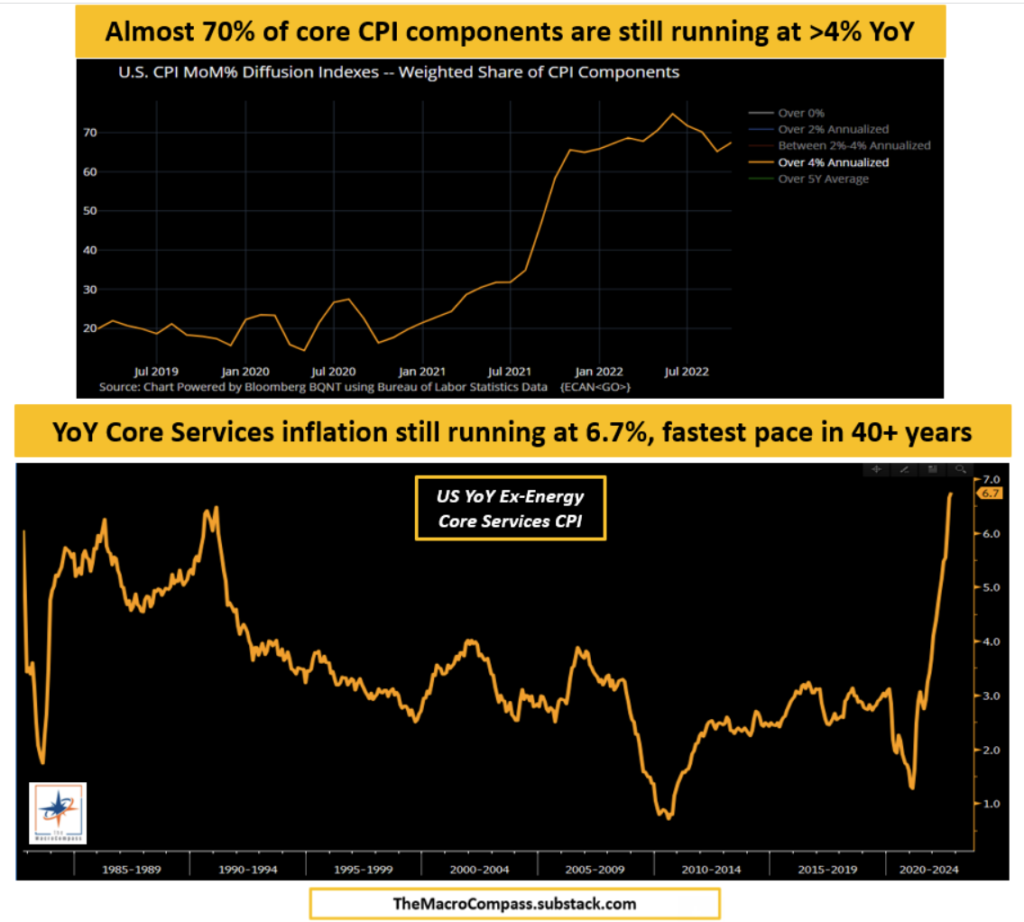 Data as of 11.11.2022
JD: The rate of producer price inflation may have peaked but is still running way above the Fed’s 2% goal
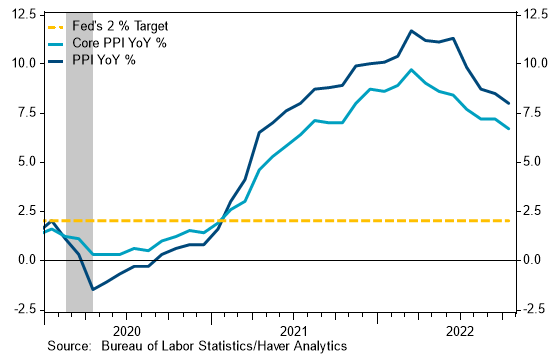
Source: Stifel as of 11.15
JL: and investors are still debating daily whether prices will follow a 1940s or 1970s path
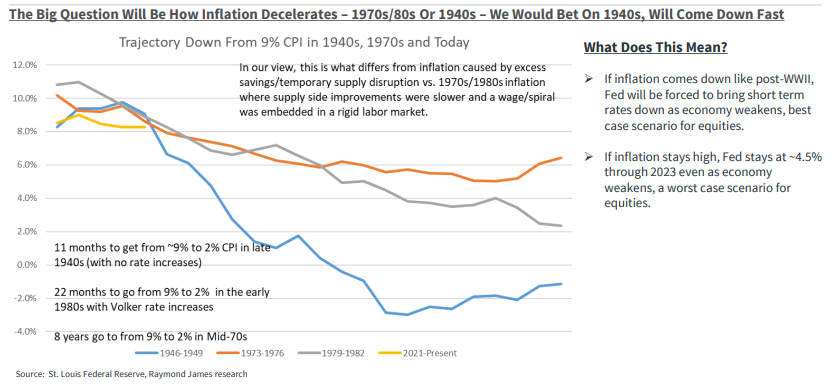
Source: Raymond James as of 11.17.2022
Beckham: Historically, rate hikes have stopped once short-term rates rose above than long-term rates
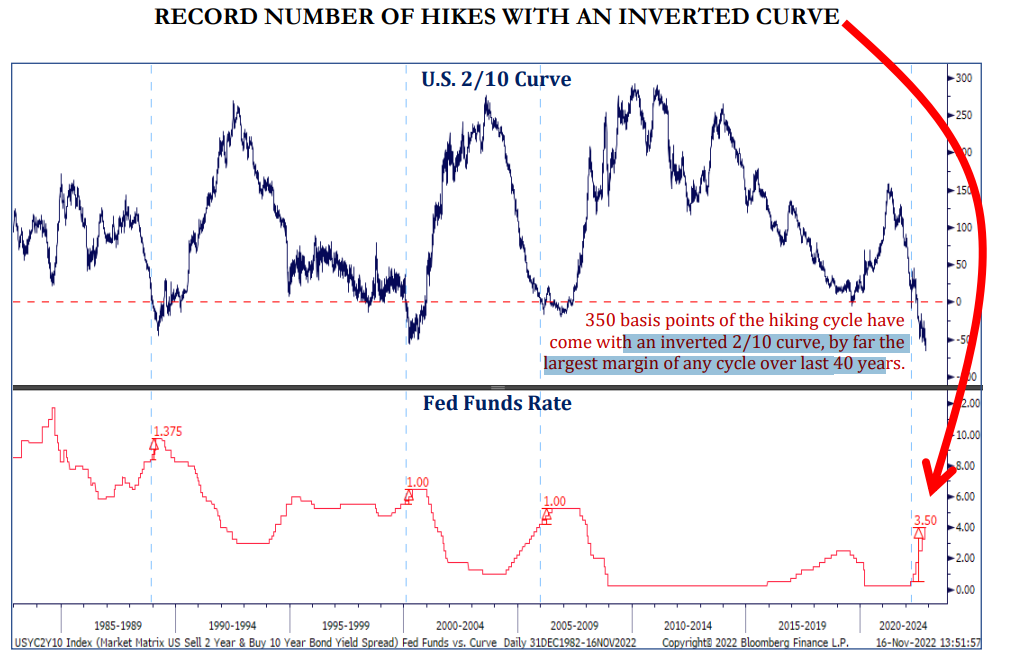
Source: Strategas as of 11.17.2022
JL: and the current inversion has now reached into the 3 month/10 year curve
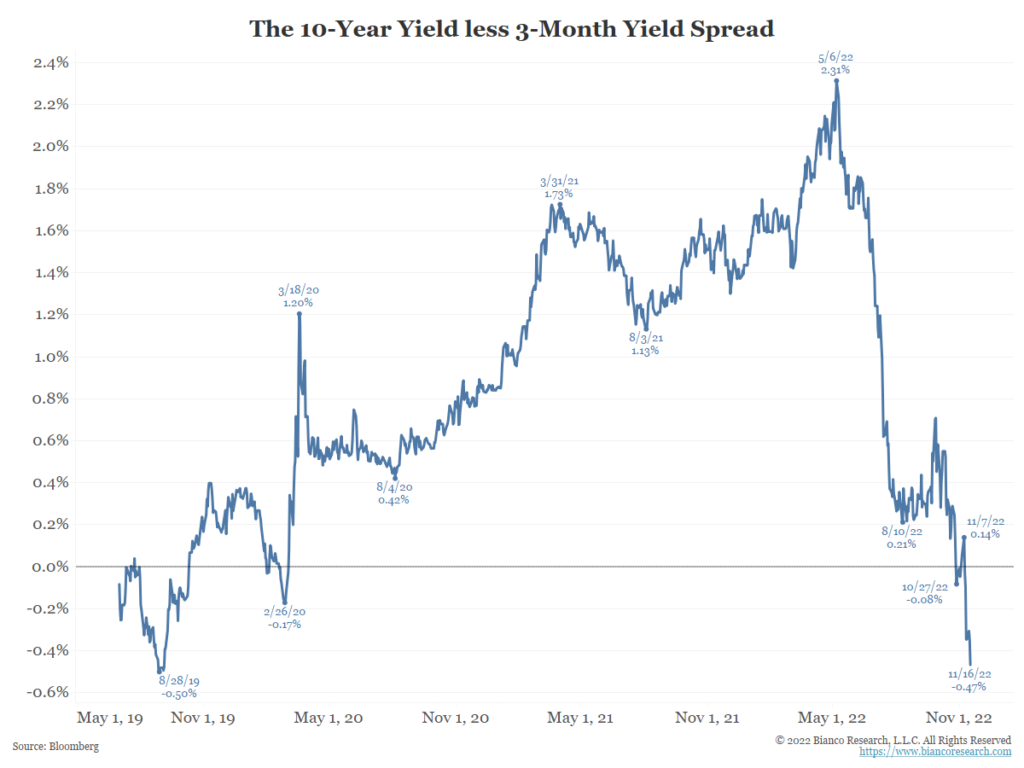
Source: Bianco as of 11.16.2022
Joseph: Prior bear markets have often signaled a shift in sector leadership
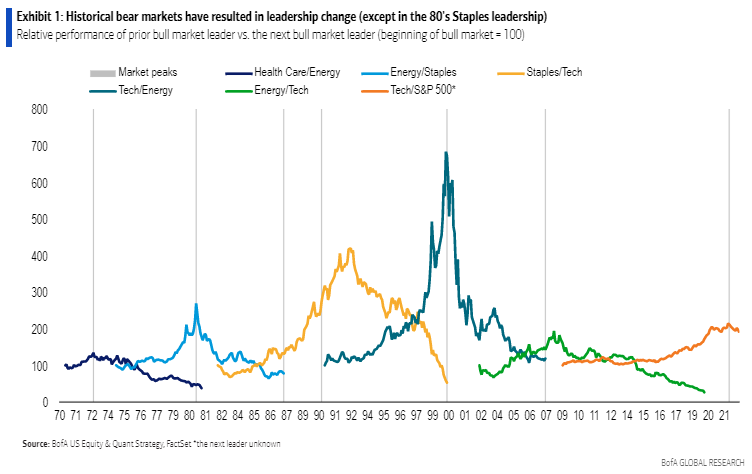
Data as of 09.30.2022
JL: which could be significant given the extreme weight hit by the famed megacap tech names
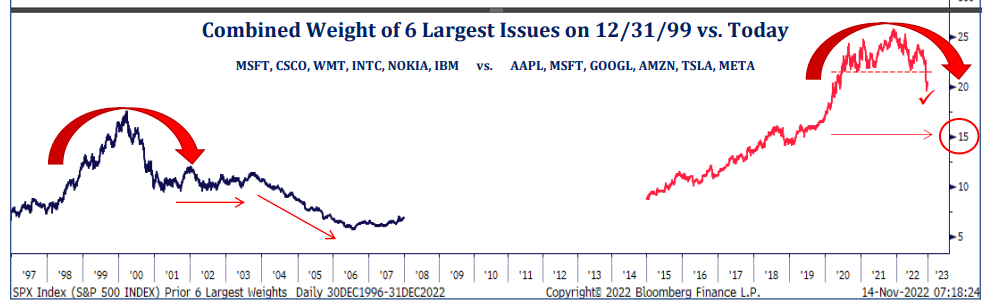
Source: Strategas as of 11.14.2022
Dave: and deliver extreme episodes of performance disparities
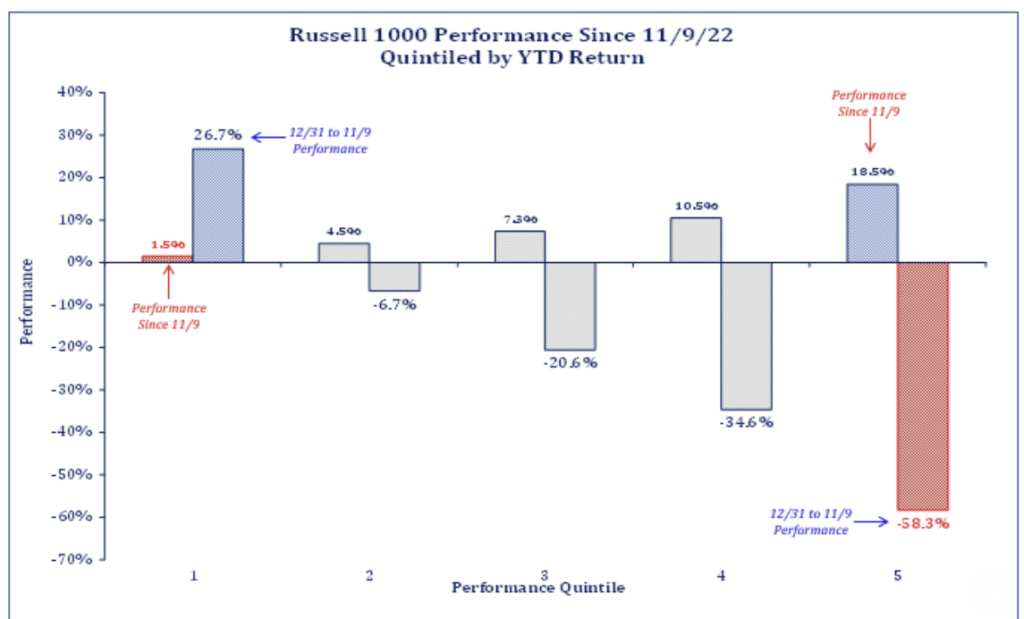
Source: Strategas as of 11.16.2022
JL: Earnings estimates have historically tracked closely with stock prices
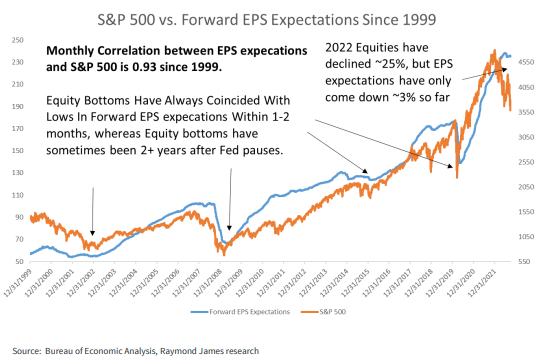
Data as of 09.30.2022
Dave: and earnings are finally showing showing signs of moving in tandem with stock prices to the downside
JL: which makes (lower) earnings yields a lot less attractive relative to (higher) Treasury yields
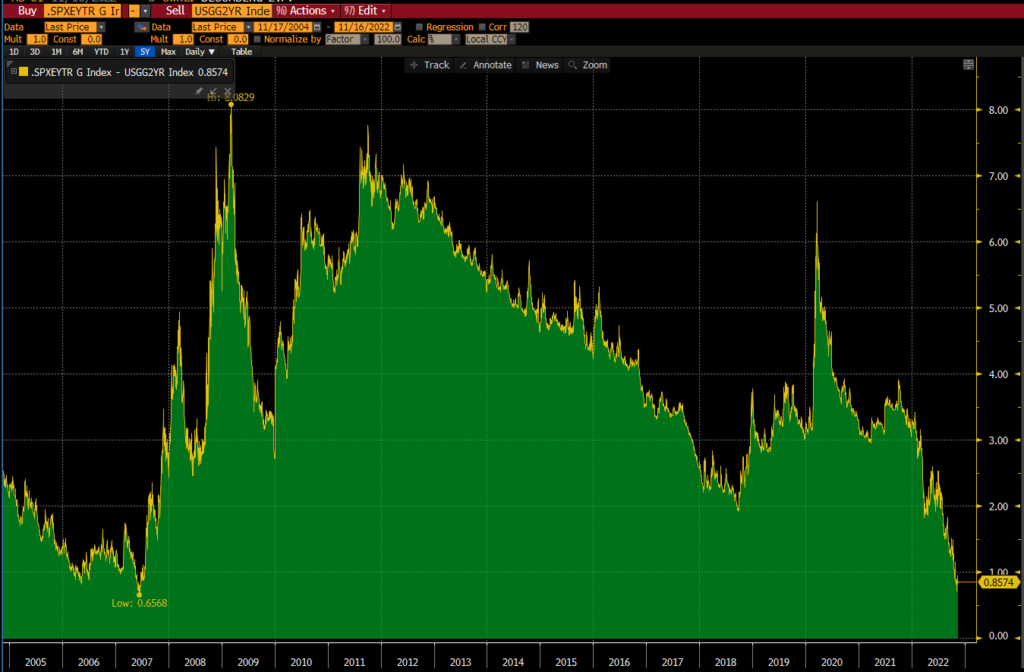
Source: Bloomberg as of 11.16.2022
Disclosures
Past performance is not indicative of future results. This material is not financial advice or an offer to sell any product. The information contained herein should not be considered a recommendation to purchase or sell any particular security. Forward looking statements cannot be guaranteed. Projections or other forward-looking statements regarding future financial performance of markets are only predictions and actual events or results may differ materially.
This commentary offers generalized research, not personalized investment advice. It is for informational purposes only and does not constitute a complete description of our investment services or performance. Nothing in this commentary should be interpreted to state or imply that past results are an indication of future investment returns. All investments involve risk and unless otherwise stated, are not guaranteed. Be sure to consult with an investment & tax professional before implementing any investment strategy. Investing involves risk. Principal loss is possible.
Projections or other forward-looking statements regarding future financial performance of markets are only predictions and actual events or results may differ materially.
The S&P 500® is widely regarded as the best single gauge of large-cap U.S. equities. According to our Annual Survey of Assets, an estimated USD 15.6 trillion is indexed or benchmarked to the index, with indexed assets comprising approximately USD 7.1 trillion of this total (as of Dec. 31, 2021). The index includes 500 leading companies and covers approximately 80% of available market capitalization.
The Russell 1000® Index measures the performance of the large cap segment of the U.S. equity universe. The Russell 1000 Index is a subset of the Russell 3000® Index, representing approximately 90% of the total market capitalization of that index. It includes approximately 1,000 of the largest securities based on a combination of their market capitalization and current index membership.
The Consumer Price Index (CPI) measures the change in prices paid by consumers for goods and services. The CPI reflects spending patterns for each of two population groups: all urban consumers and urban wage earners and clerical workers.
When a page is marked “Advisor Use Only” or “For Institutional Use”, the content is only intended for financial advisors, consultants, or existing and prospective institutional investors of Aptus. These materials have not been written or approved for a retail audience or use in mind and should not be distributed to retail investors. Any distribution to retail investors by a registered investment adviser may violate the new Marketing Rule under the Investment Advisers Act. If you choose to utilize or cite material we recommend the citation, be presented in context, with similar footnotes in the material and appropriate sourcing to Aptus and/or any other author or source references. This is notwithstanding any considerations or customizations with regards to your operations, based on your own compliance process, and compliance review with the marketing rule effective November 4, 2022.
Advisory services are offered through Aptus Capital Advisors, LLC, a Registered Investment Adviser registered with the Securities and Exchange Commission. Registration does not imply a certain level or skill or training. More information about the advisor, its investment strategies and objectives, is included in the firm’s Form ADV Part 2, which can be obtained, at no charge, by calling (251) 517-7198. Aptus Capital Advisors, LLC is headquartered in Fairhope, Alabama. ACA-2211-18.
