Our team looks at a lot of research throughout each day. A few charts that caught our eye this week, and how they help fill the puzzle of evidence:
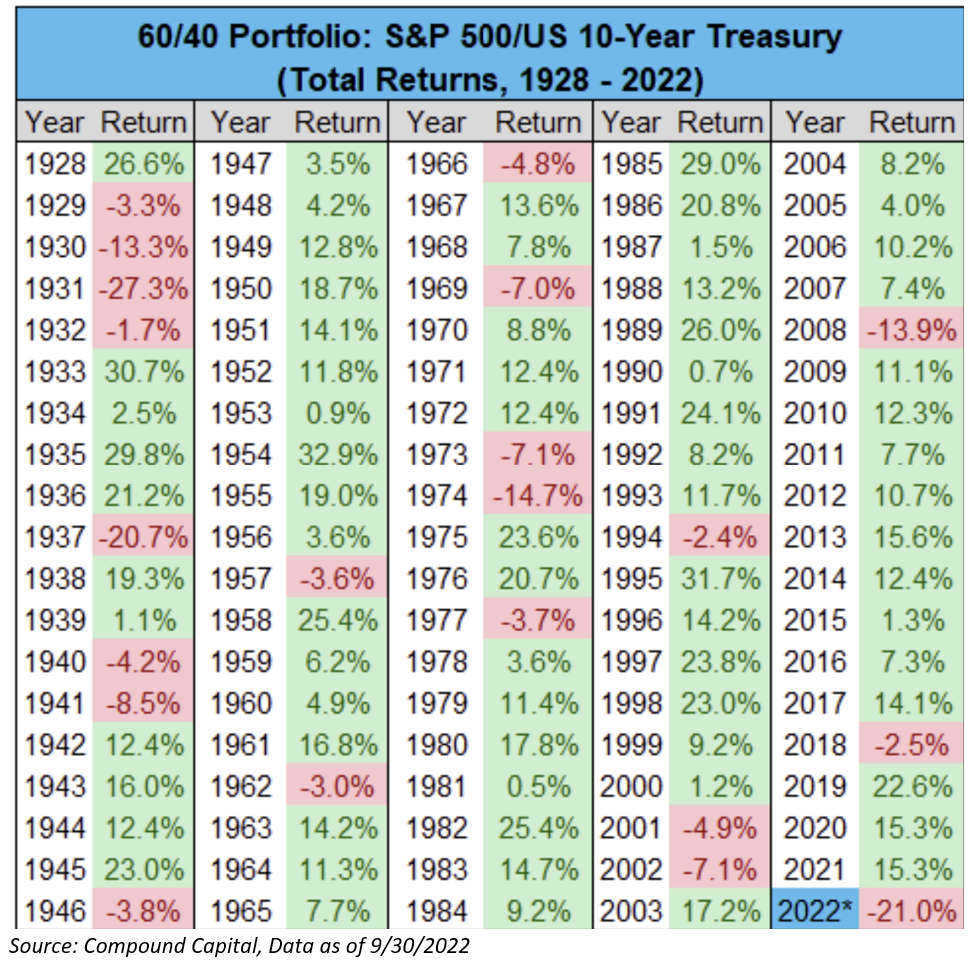
JD: We’re going through an investment environment that requires a multi-decade look back to find comps
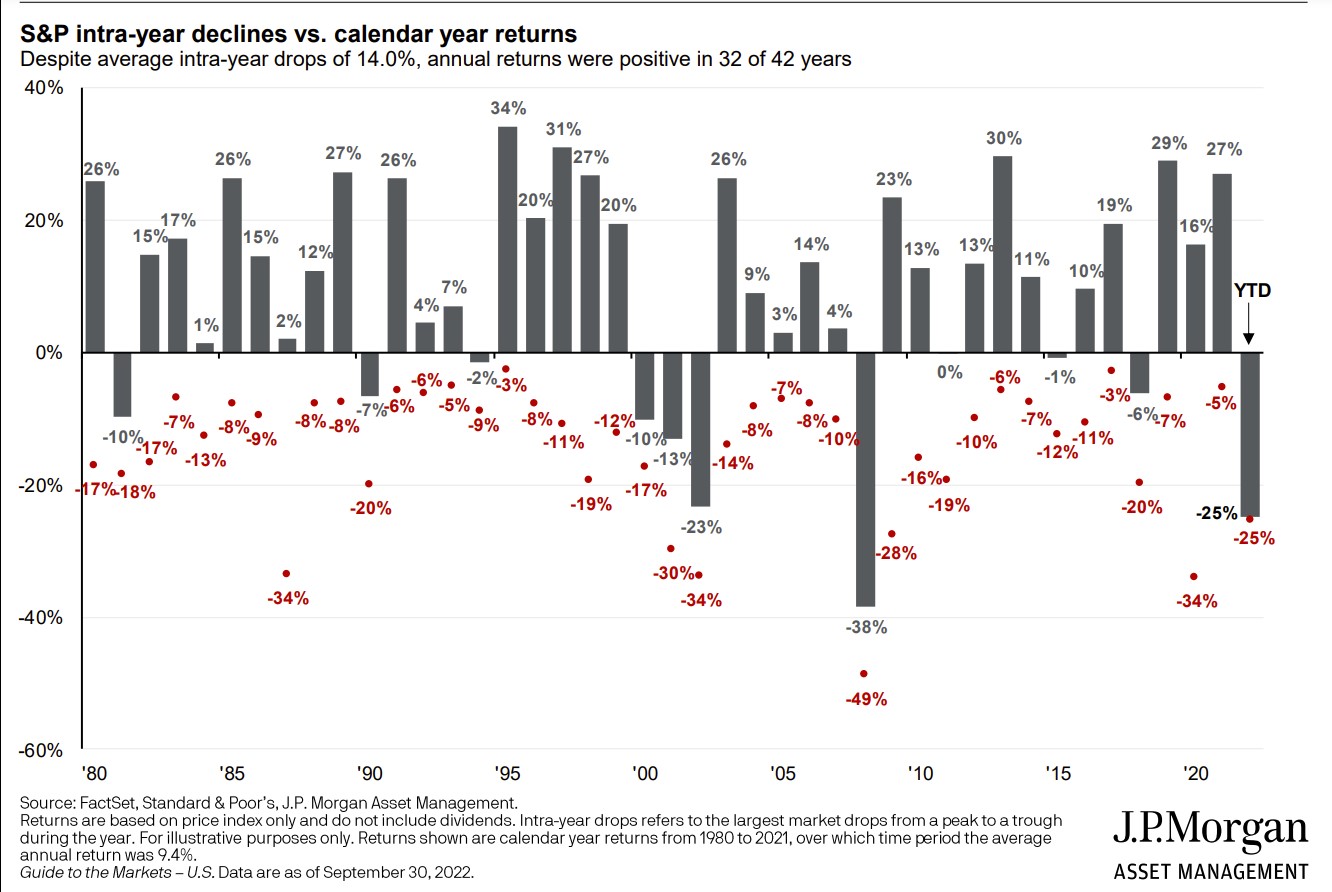
Derek: and while stock prices are going through a typical bear market decline…
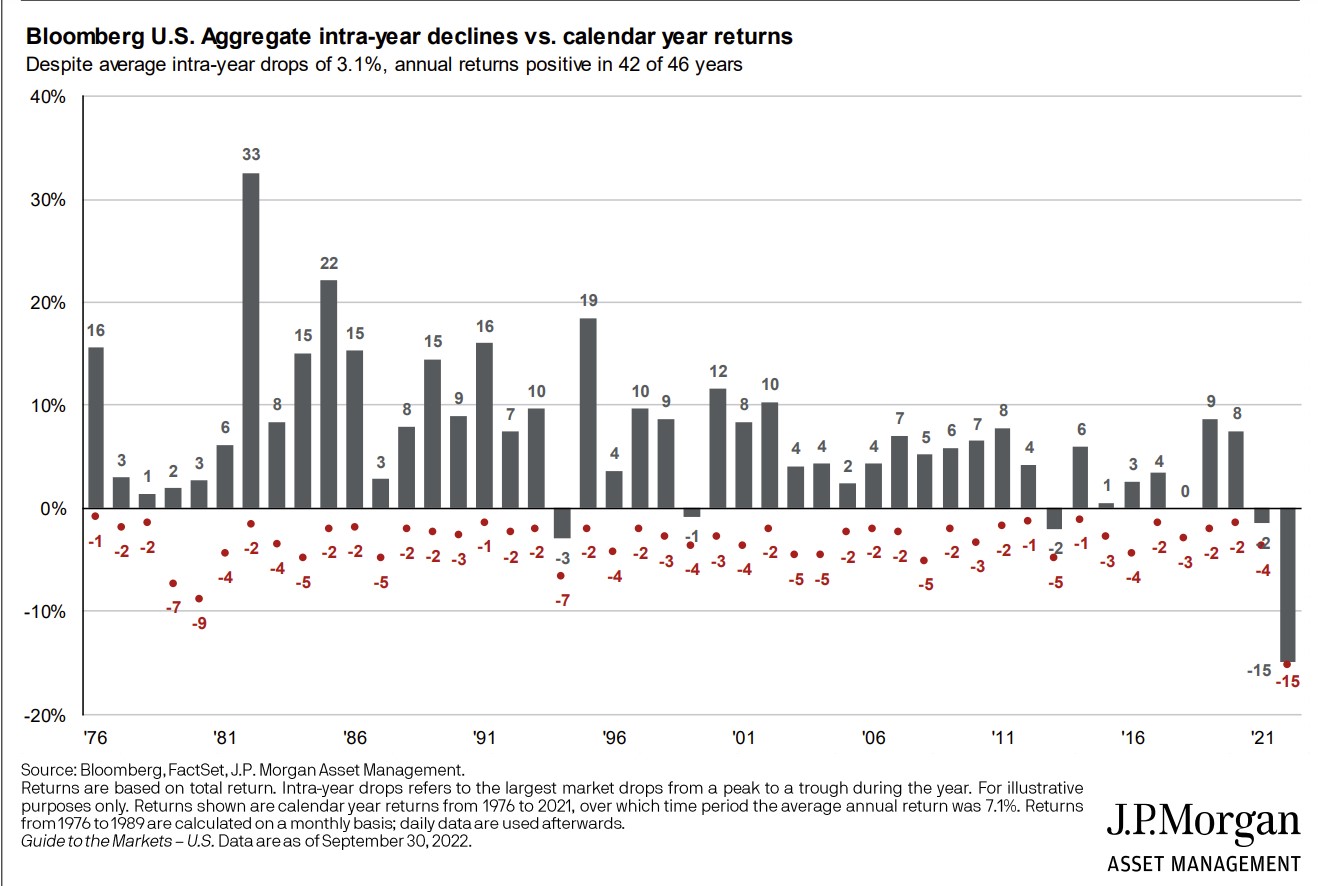
Derek: the bond market performance is unprecedented in modern history
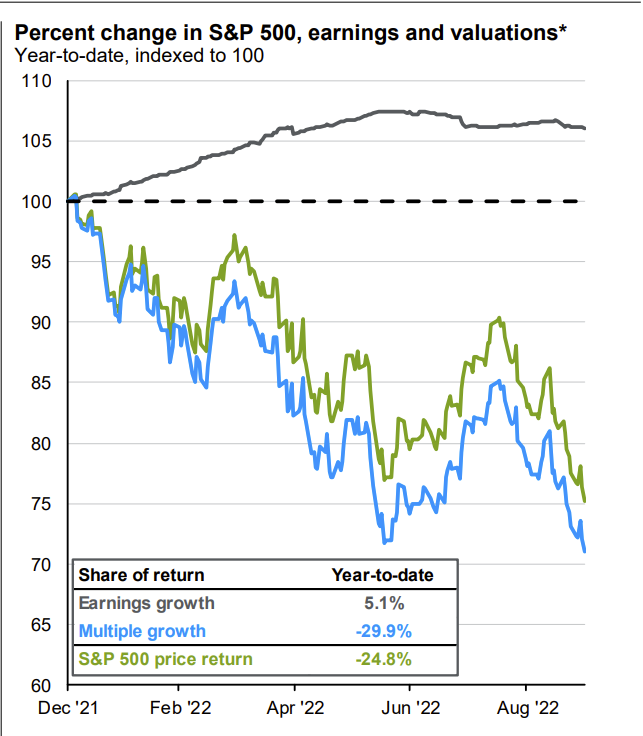
Dave: The entirety of the drop in equity prices (and then some) is due to valuations compressing
 Source: JP Morgan as of 09.30.2022
Brad: and we can only guesstimate the end state of this decline in valuations, especially if earnings stop growing
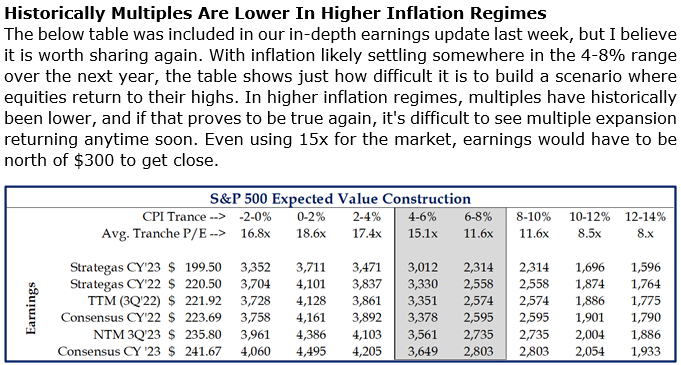 Source: Strategas as of 10.03.2022
John Luke: We know that Wall Street strategists will always plug in 2% for their long-term inflation forecast
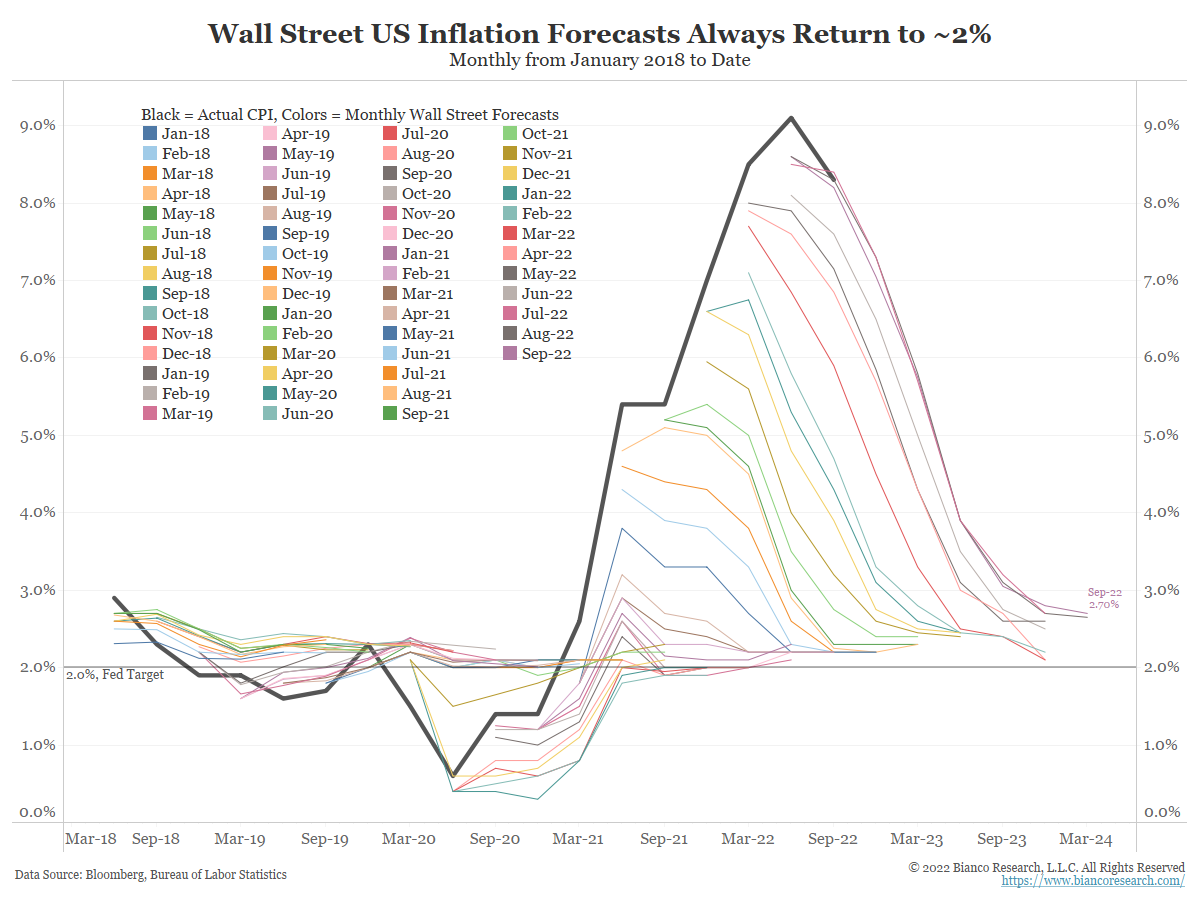 Data as of 09.30.2022
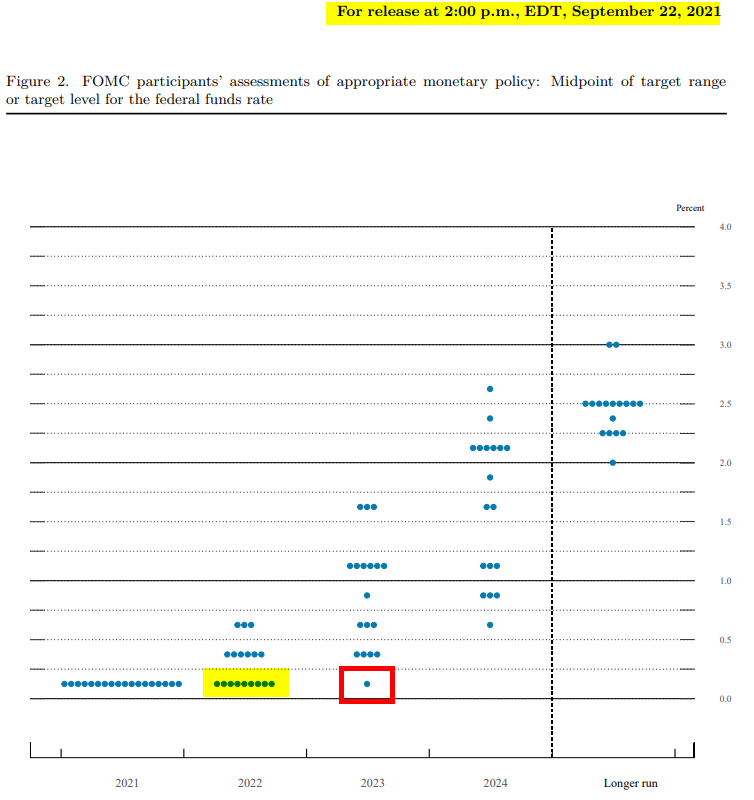
John Luke: which is at least a notch above Fed members who a year ago thought the rate they set would still be zero
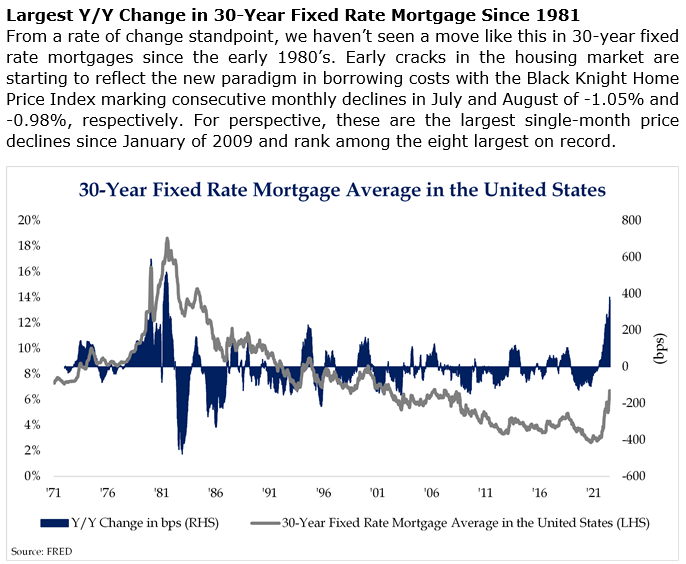
 Source: Bespoke 10.05.2022
Brad: We all know the free money from the refi boom is over, but the rise in mortgage rates is pretty historic
 Source: Strategas as of 10.04.2022
John Luke: and the free money from the government also hit a brick wall
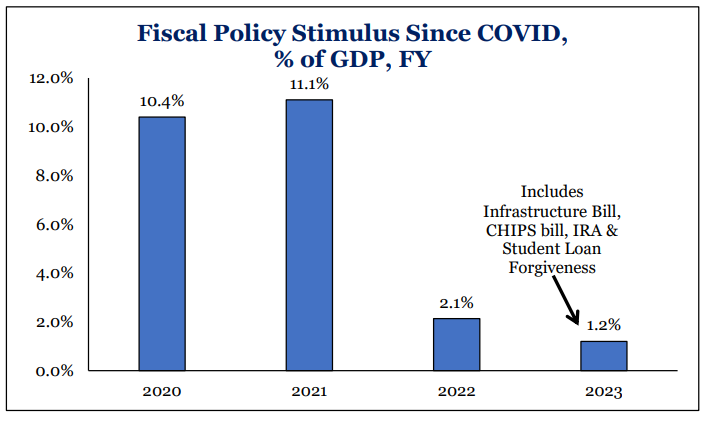 Source: Strategas as of 10.03.2022
Brad: Thankfully, as active participants we can tilt towards areas of the market with more favorable prospects and/or valuations
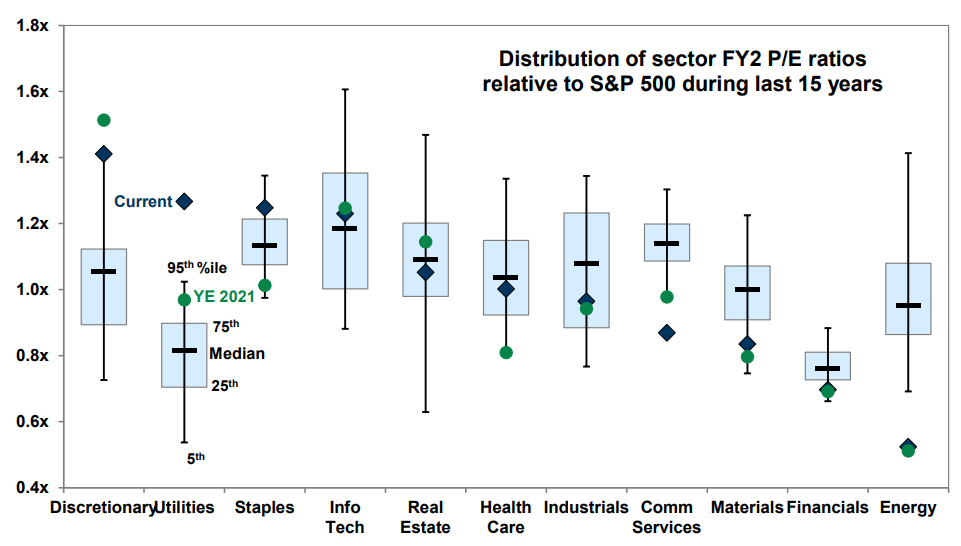 Source: Goldman Sachs as of 10.04.2022
Joseph: and as equity owners, look to benefit from the historically positive periods following midterm elections
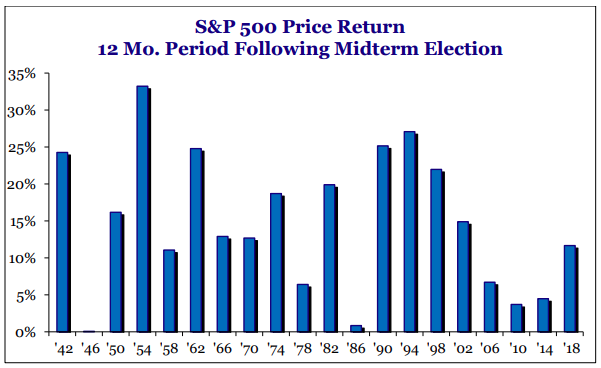 Source: Strategas as of 09.30.2022
Disclosures
Past performance is not indicative of future results. This material is not financial advice or an offer to sell any product. The information contained herein should not be considered a recommendation to purchase or sell any particular security. Forward looking statements cannot be guaranteed. Projections or other forward-looking statements regarding future financial performance of markets are only predictions and actual events or results may differ materially.
This commentary offers generalized research, not personalized investment advice. It is for informational purposes only and does not constitute a complete description of our investment services or performance. Nothing in this commentary should be interpreted to state or imply that past results are an indication of future investment returns. All investments involve risk and unless otherwise stated, are not guaranteed. Be sure to consult with an investment & tax professional before implementing any investment strategy. Investing involves risk. Principal loss is possible.
The S&P 500® Index is the Standard & Poor’s Composite Index and is widely regarded as a single gauge of large cap U.S. equities. It is market cap weighted and includes 500 leading companies, capturing approximately 80% coverage of available market capitalization.
The Bloomberg Barclays US Aggregate Bond Index is a broad-based flagship benchmark that measures the investment grade, US dollar-denominated, fixed-rate taxable bond market. The index includes Treasuries, government related and corporate securities, MBS (agency fixed-rate pass-throughs), ABS and CMBS (agency and non-agency).
The MOVE Index (Merrill Lynch Option Volatility Estimate) measures the market’s expectation of implied volatility of the US bond market using 1-month Treasury options weighted for 2, 5, 10, and 30 year contracts.
Created by the Chicago Board Options Exchange (CBOE), the Volatility Index, or VIX, is a real-time market index that represents the market’s expectation of 30-day forward-looking volatility. Derived from the price inputs of the S&P 500 index options, it provides a measure of market risk and investors’ sentiments.
The Consumer Price Index (CPI) measures the change in prices paid by consumers for goods and services. The CPI reflects spending patterns for each of two population groups: all urban consumers and urban wage earners and clerical workers.
The PCE Price Index Excluding Food and Energy, also known as the core PCE price index, is released as part of the monthly Personal Income and Outlays report. The core index makes it easier to see the underlying inflation trend by excluding two categories – food and energy – where prices tend to swing up and down more dramatically and more often than other prices.
The 10 Year Treasury Rate is the yield received for investing in a US government issued treasury security that has a maturity of 10 year. The 10 year treasury yield is included on the longer end of the yield curve. Many analysts will use the 10 year yield as the “risk free” rate when valuing the markets or an individual security.
Advisory services are offered through Aptus Capital Advisors, LLC, a Registered Investment Adviser registered with the Securities and Exchange Commission. Registration does not imply a certain level or skill or training. More information about the advisor, its investment strategies and objectives, is included in the firm’s Form ADV Part 2, which can be obtained, at no charge, by calling (251) 517-7198. Aptus Capital Advisors, LLC is headquartered in Fairhope, Alabama. ACA-2210-7.
