Our team looks at a lot of research throughout each day. A few charts that caught our eye this week, and how they help fill the puzzle of evidence:
Dave: The first half of 2022 mostly driven by Fed hikes, but 2nd half looks like an earnings story…
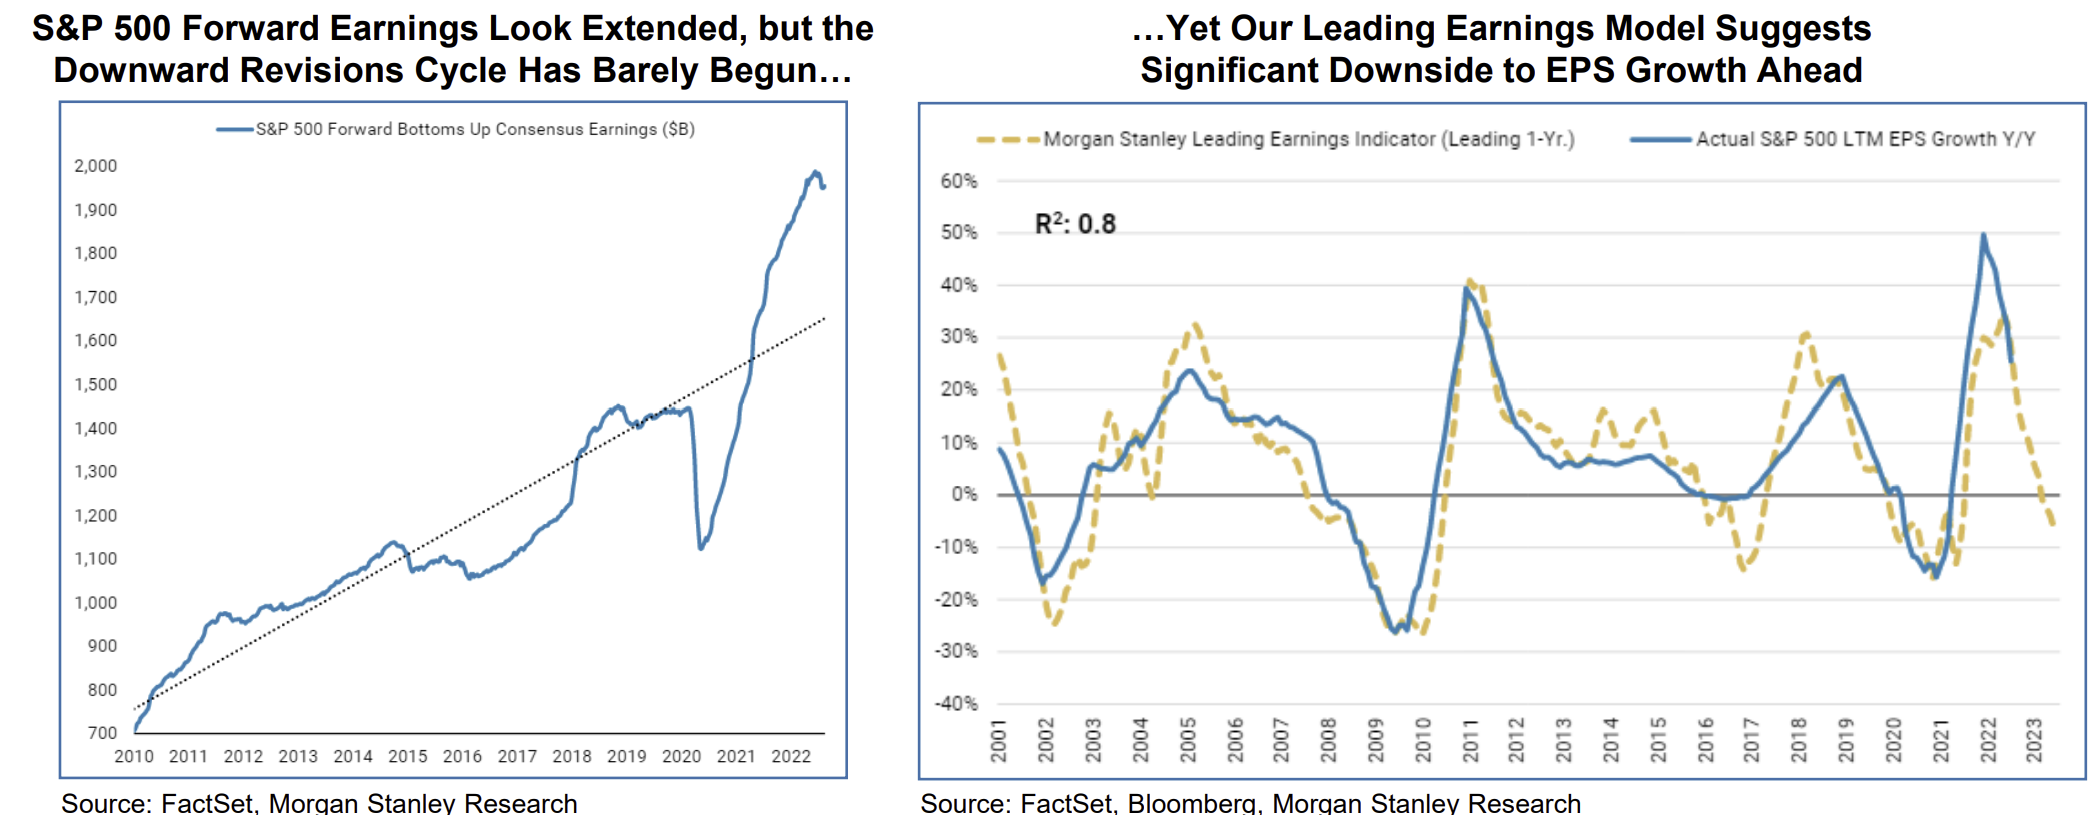 Data as of 08.30.22
Joseph: Small-caps are already pricing a recession but large caps are richly priced even w/o estimate cuts
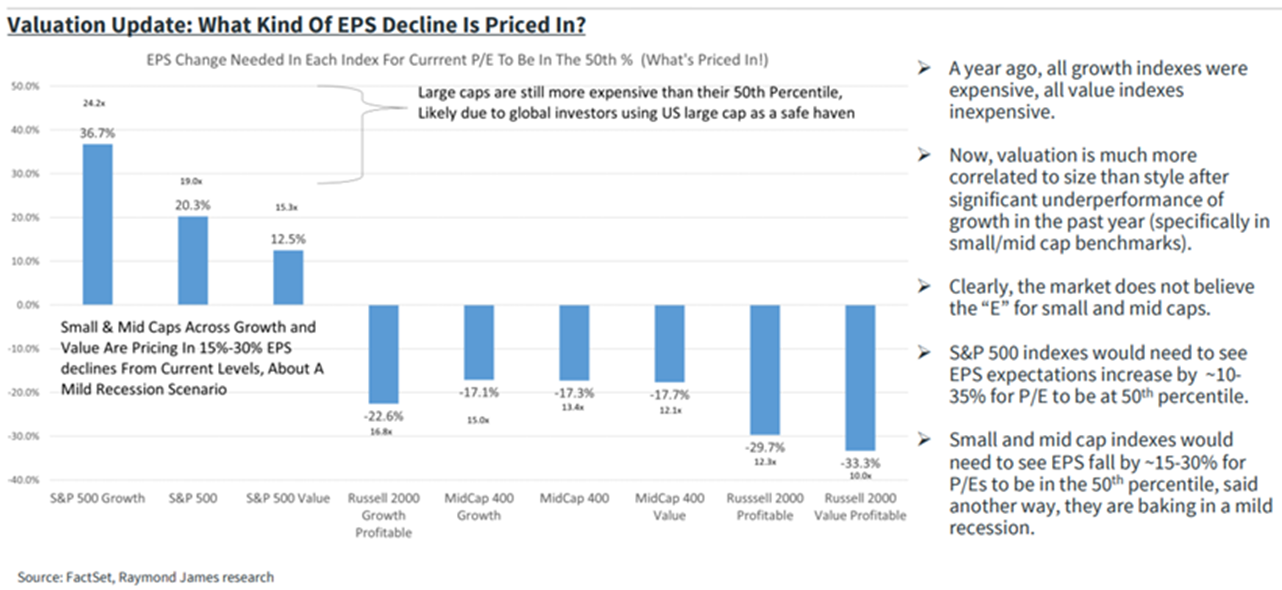 Data as of 08.30.2022
JL: Volatility as measured by VIX has been awfully tame in 2022
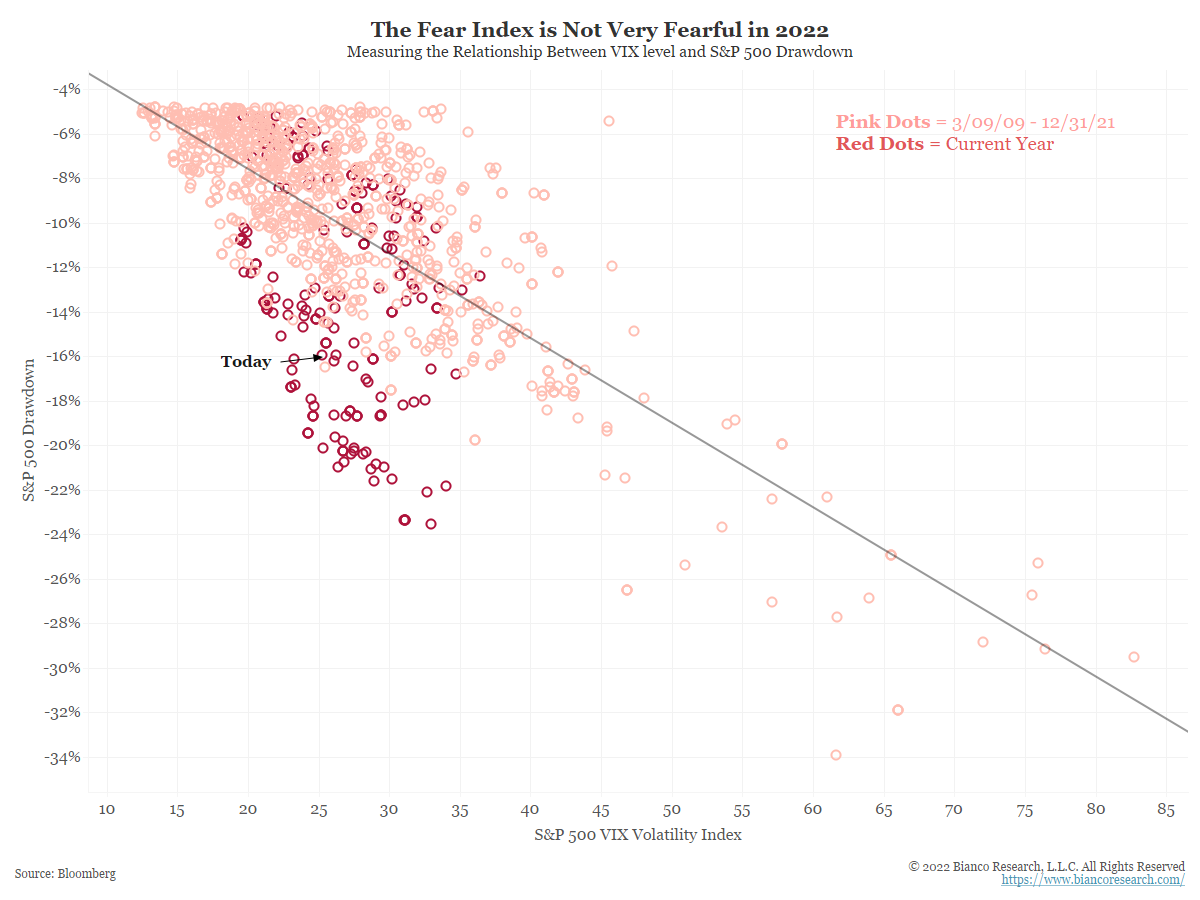 Data as of 08.30.22
Dave: …as we head into the historically weakest month of the year
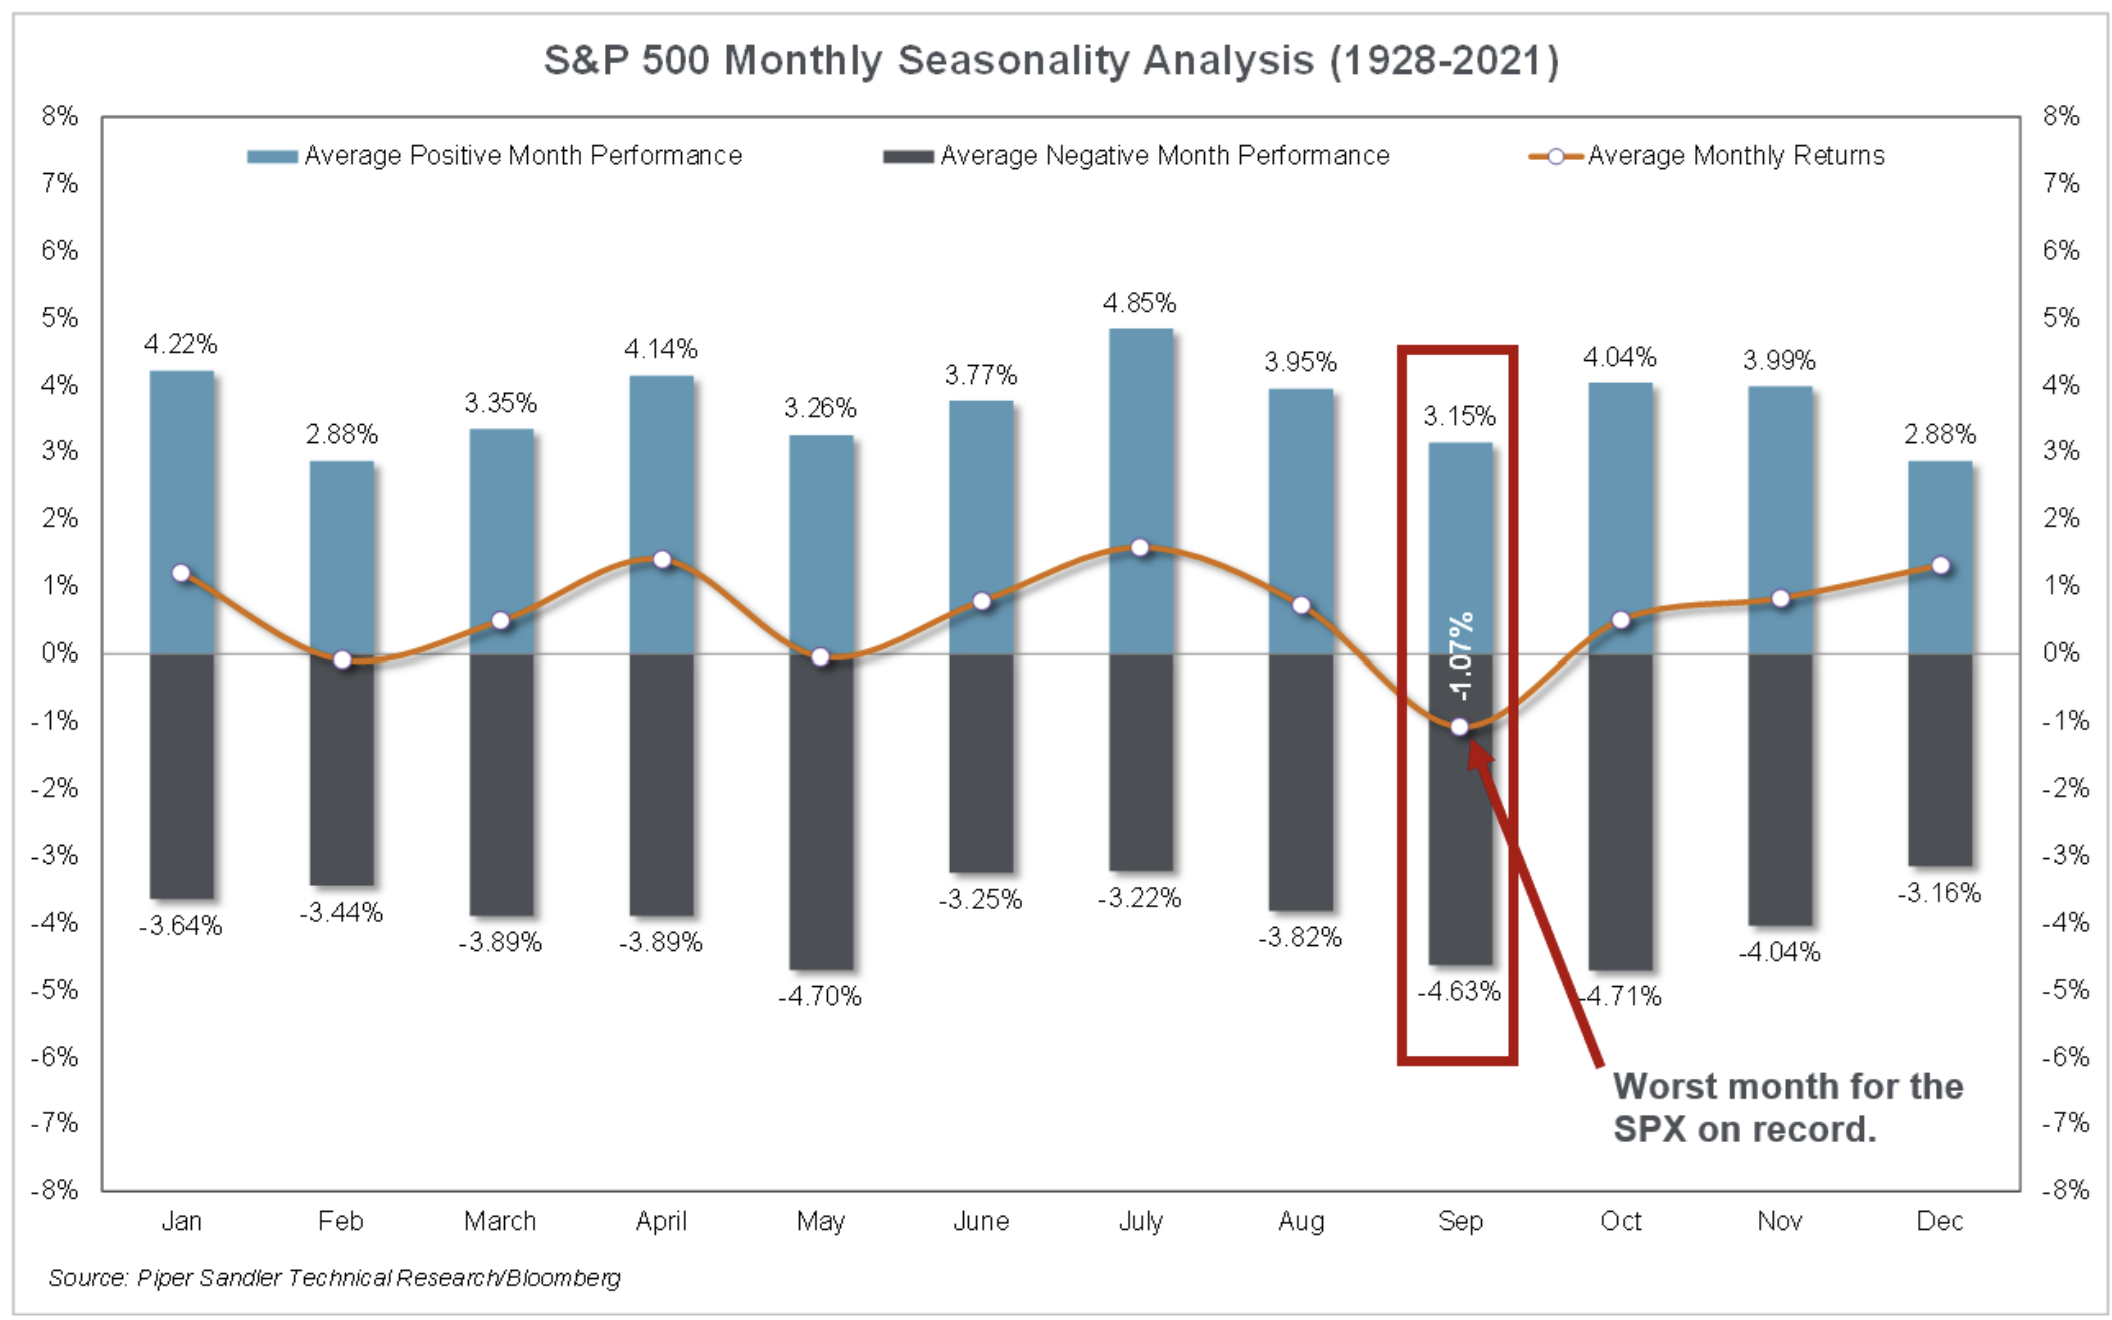 Data as of 08.31.2022
Beckham: The floating rate market could become a key area of trouble
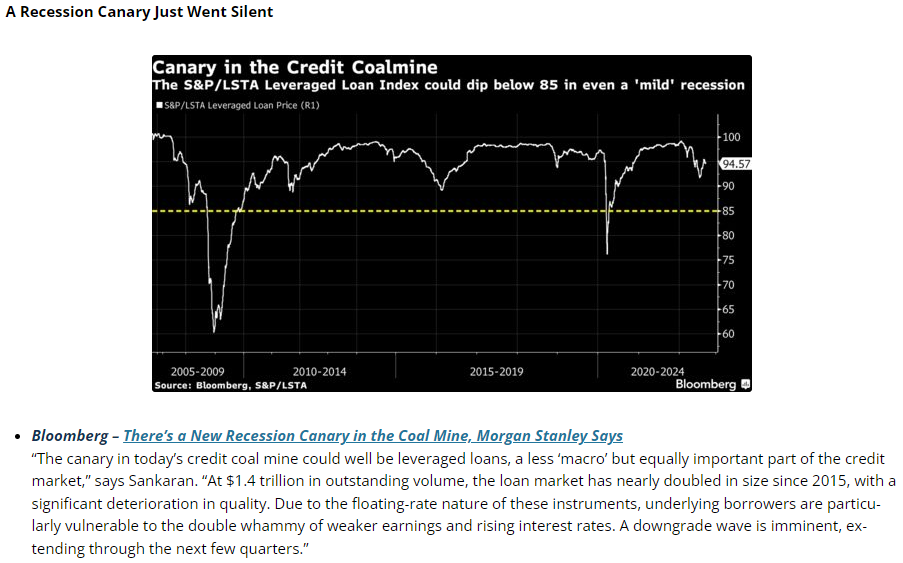 Source: Bianco as of 08.31.2022
JL: In a year that’s already by far the worst for bondholders since the inception of the Bond Aggregate Index
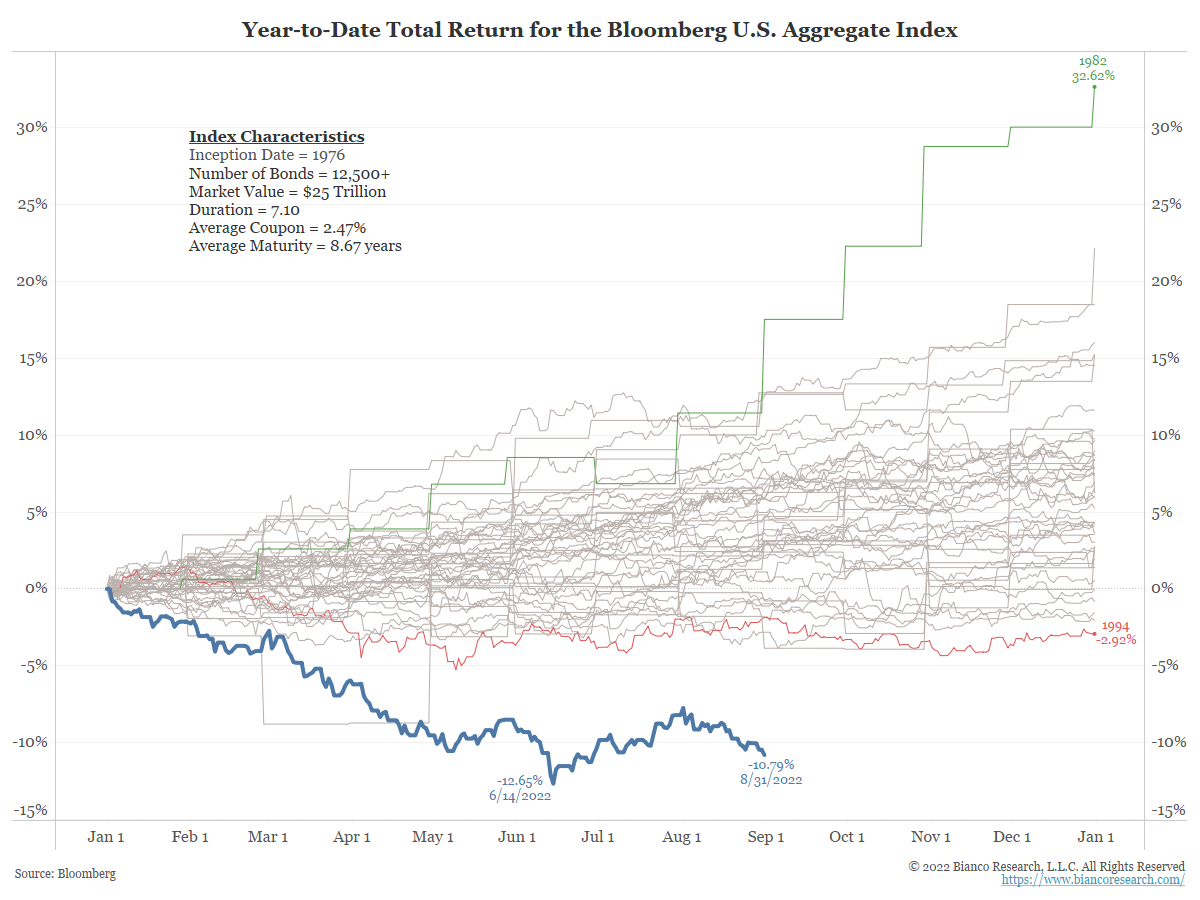 Data as of 09.01.22
Dave: Retail gas prices continue to fall, and the fall in wholesale prices leaves the potential for continued declines
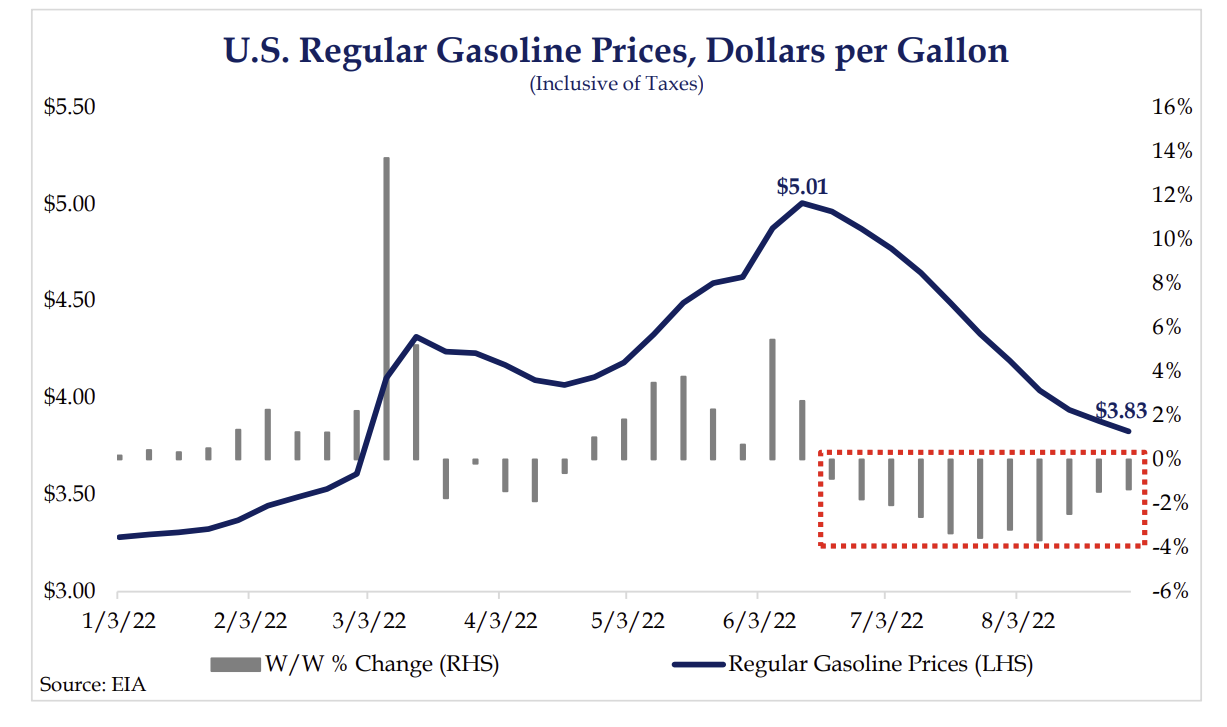 Source: Strategas as of 09.01.2022
Joseph: While crack spreads have round-tripped the entire spike in profit margins
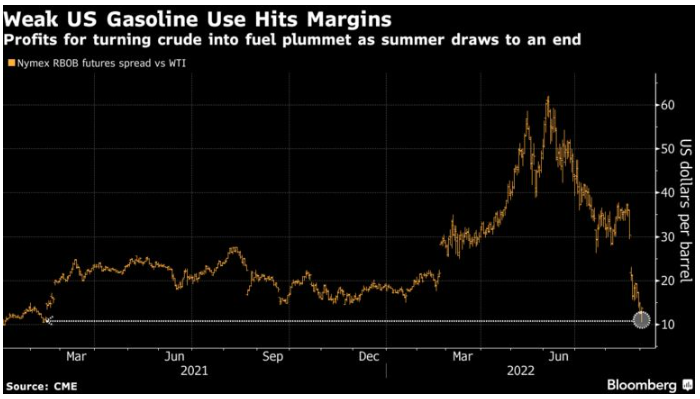 Data as of 09.01.22
JL: Monetary policy alone cannot tame inflation when fiscal spending remains overly accommodative
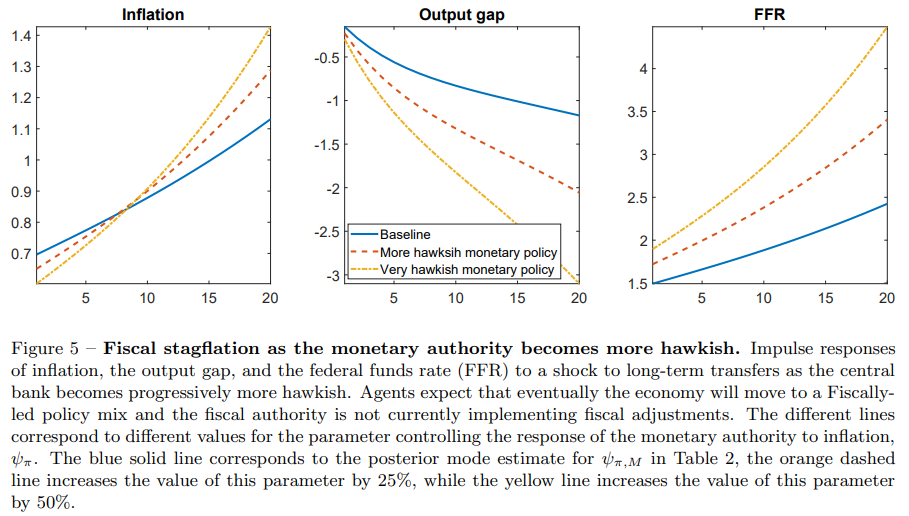 Source: Kansas City Fed as of 08.19.2022
Disclosures
Past performance is not indicative of future results. This material is not financial advice or an offer to sell any product. The information contained herein should not be considered a recommendation to purchase or sell any particular security. Forward looking statements cannot be guaranteed.
This commentary offers generalized research, not personalized investment advice. It is for informational purposes only and does not constitute a complete description of our investment services or performance. Nothing in this commentary should be interpreted to state or imply that past results are an indication of future investment returns. All investments involve risk and unless otherwise stated, are not guaranteed. Be sure to consult with an investment & tax professional before implementing any investment strategy. Investing involves risk. Principal loss is possible.
The S&P 500® Index is the Standard & Poor’s Composite Index and is widely regarded as a single gauge of large cap U.S. equities. It is market cap weighted and includes 500 leading companies, capturing approximately 80% coverage of available market capitalization.
Created by the Chicago Board Options Exchange (CBOE), the Volatility Index, or VIX, is a real-time market index that represents the market’s expectation of 30-day forward-looking volatility. Derived from the price inputs of the S&P 500 index options, it provides a measure of market risk and investors’ sentiments.
The Bloomberg Barclays US Aggregate Bond Index is a broad-based flagship benchmark that measures the investment grade, US dollar-denominated, fixed-rate taxable bond market. The index includes Treasuries, government related and corporate securities, MBS (agency fixed-rate pass-throughs), ABS and CMBS (agency and non-agency).
Advisory services are offered through Aptus Capital Advisors, LLC, a Registered Investment Adviser registered with the Securities and Exchange Commission. Registration does not imply a certain level or skill or training. More information about the advisor, its investment strategies and objectives, is included in the firm’s Form ADV Part 2, which can be obtained, at no charge, by calling (251) 517-7198. Aptus Capital Advisors, LLC is headquartered in Fairhope, Alabama. ACA-2209-4.
